| Tellurian Inc. Corporate presentation |

| Cautionary statements The information in this presentation includes “forward-looking statements” within the meaning of Section 27A of the Securities Act of 1933, as amended, and Section 21E of the Securities Exchange Act of 1934, as amended. All statements other than statements of historical fact are forward-looking statements. The words “anticipate,” “assume,” “believe,” “budget,” “estimate,” “expect,” “forecast,” “initial,” “intend,” “may,” “model,” “plan,” “potential,” “project,” “should,” “will,” “would,” and similar expressions are intended to identify forward-looking statements. The forward- looking statements in this presentation relate to, among other things, the benefits of the proposed integrated structure for Driftwood, production and revenues, expansion of upstream position, including with respect to the timing and anticipated benefits of the EnSight acquisition, Driftwood financing matters, future development, margins, cash flow, returns and asset-level EBITDA, wells and locations, drilling and other development activities, commodity prices and demand, funding of future phases, liquefaction capacity additions, construction of LNG projects, Driftwood capacity, emissions, future demand and supply affecting LNG and general energy markets, future transactions and other aspects of our business and our prospects and those of other industry participants. Our forward-looking statements are based on assumptions and analyses made by us in light of our experience and our perception of historical trends, current conditions, expected future developments, and other factors that we believe are appropriate under the circumstances. These statements are subject to numerous known and unknown risks and uncertainties which may cause actual results to be materially different from any future results or performance expressed or implied by the forward-looking statements. These risks and uncertainties include those described in the “Risk Factors” section of our Annual Report on Form 10-K for the fiscal year ended December 31, 2021, and our other filings with the Securities and Exchange Commission, which are incorporated by reference in this presentation. Many of the forward-looking statements in this presentation relate to events or developments anticipated to occur numerous years in the future, which increases the likelihood that actual results will differ materially from those indicated in such forward-looking statements. FID is subject to the completion of financing arrangements that may not be completed within the time frame expected or at all. The financial information included on slides 7, 10, 11 and 14 is meant for illustrative purposes only and does not purport to show estimates of actual future financial performance. The information on those slides assumes the completion of certain acquisition, financing and other transactions. Such transactions may not be completed on the assumed terms or at all. Actual commodity prices may vary materially from the commodity prices assumed for the purposes of the illustrative financial performance information. Estimates of “resources” and other non-proved reserves are subject to substantially greater risk than are estimates of proved reserves. The forward-looking statements made in or in connection with this presentation speak only as of the date hereof. Although we may from time to time voluntarily update our prior forward-looking statements, we disclaim any commitment to do so except as required by securities laws. Forward-looking statements 2 |
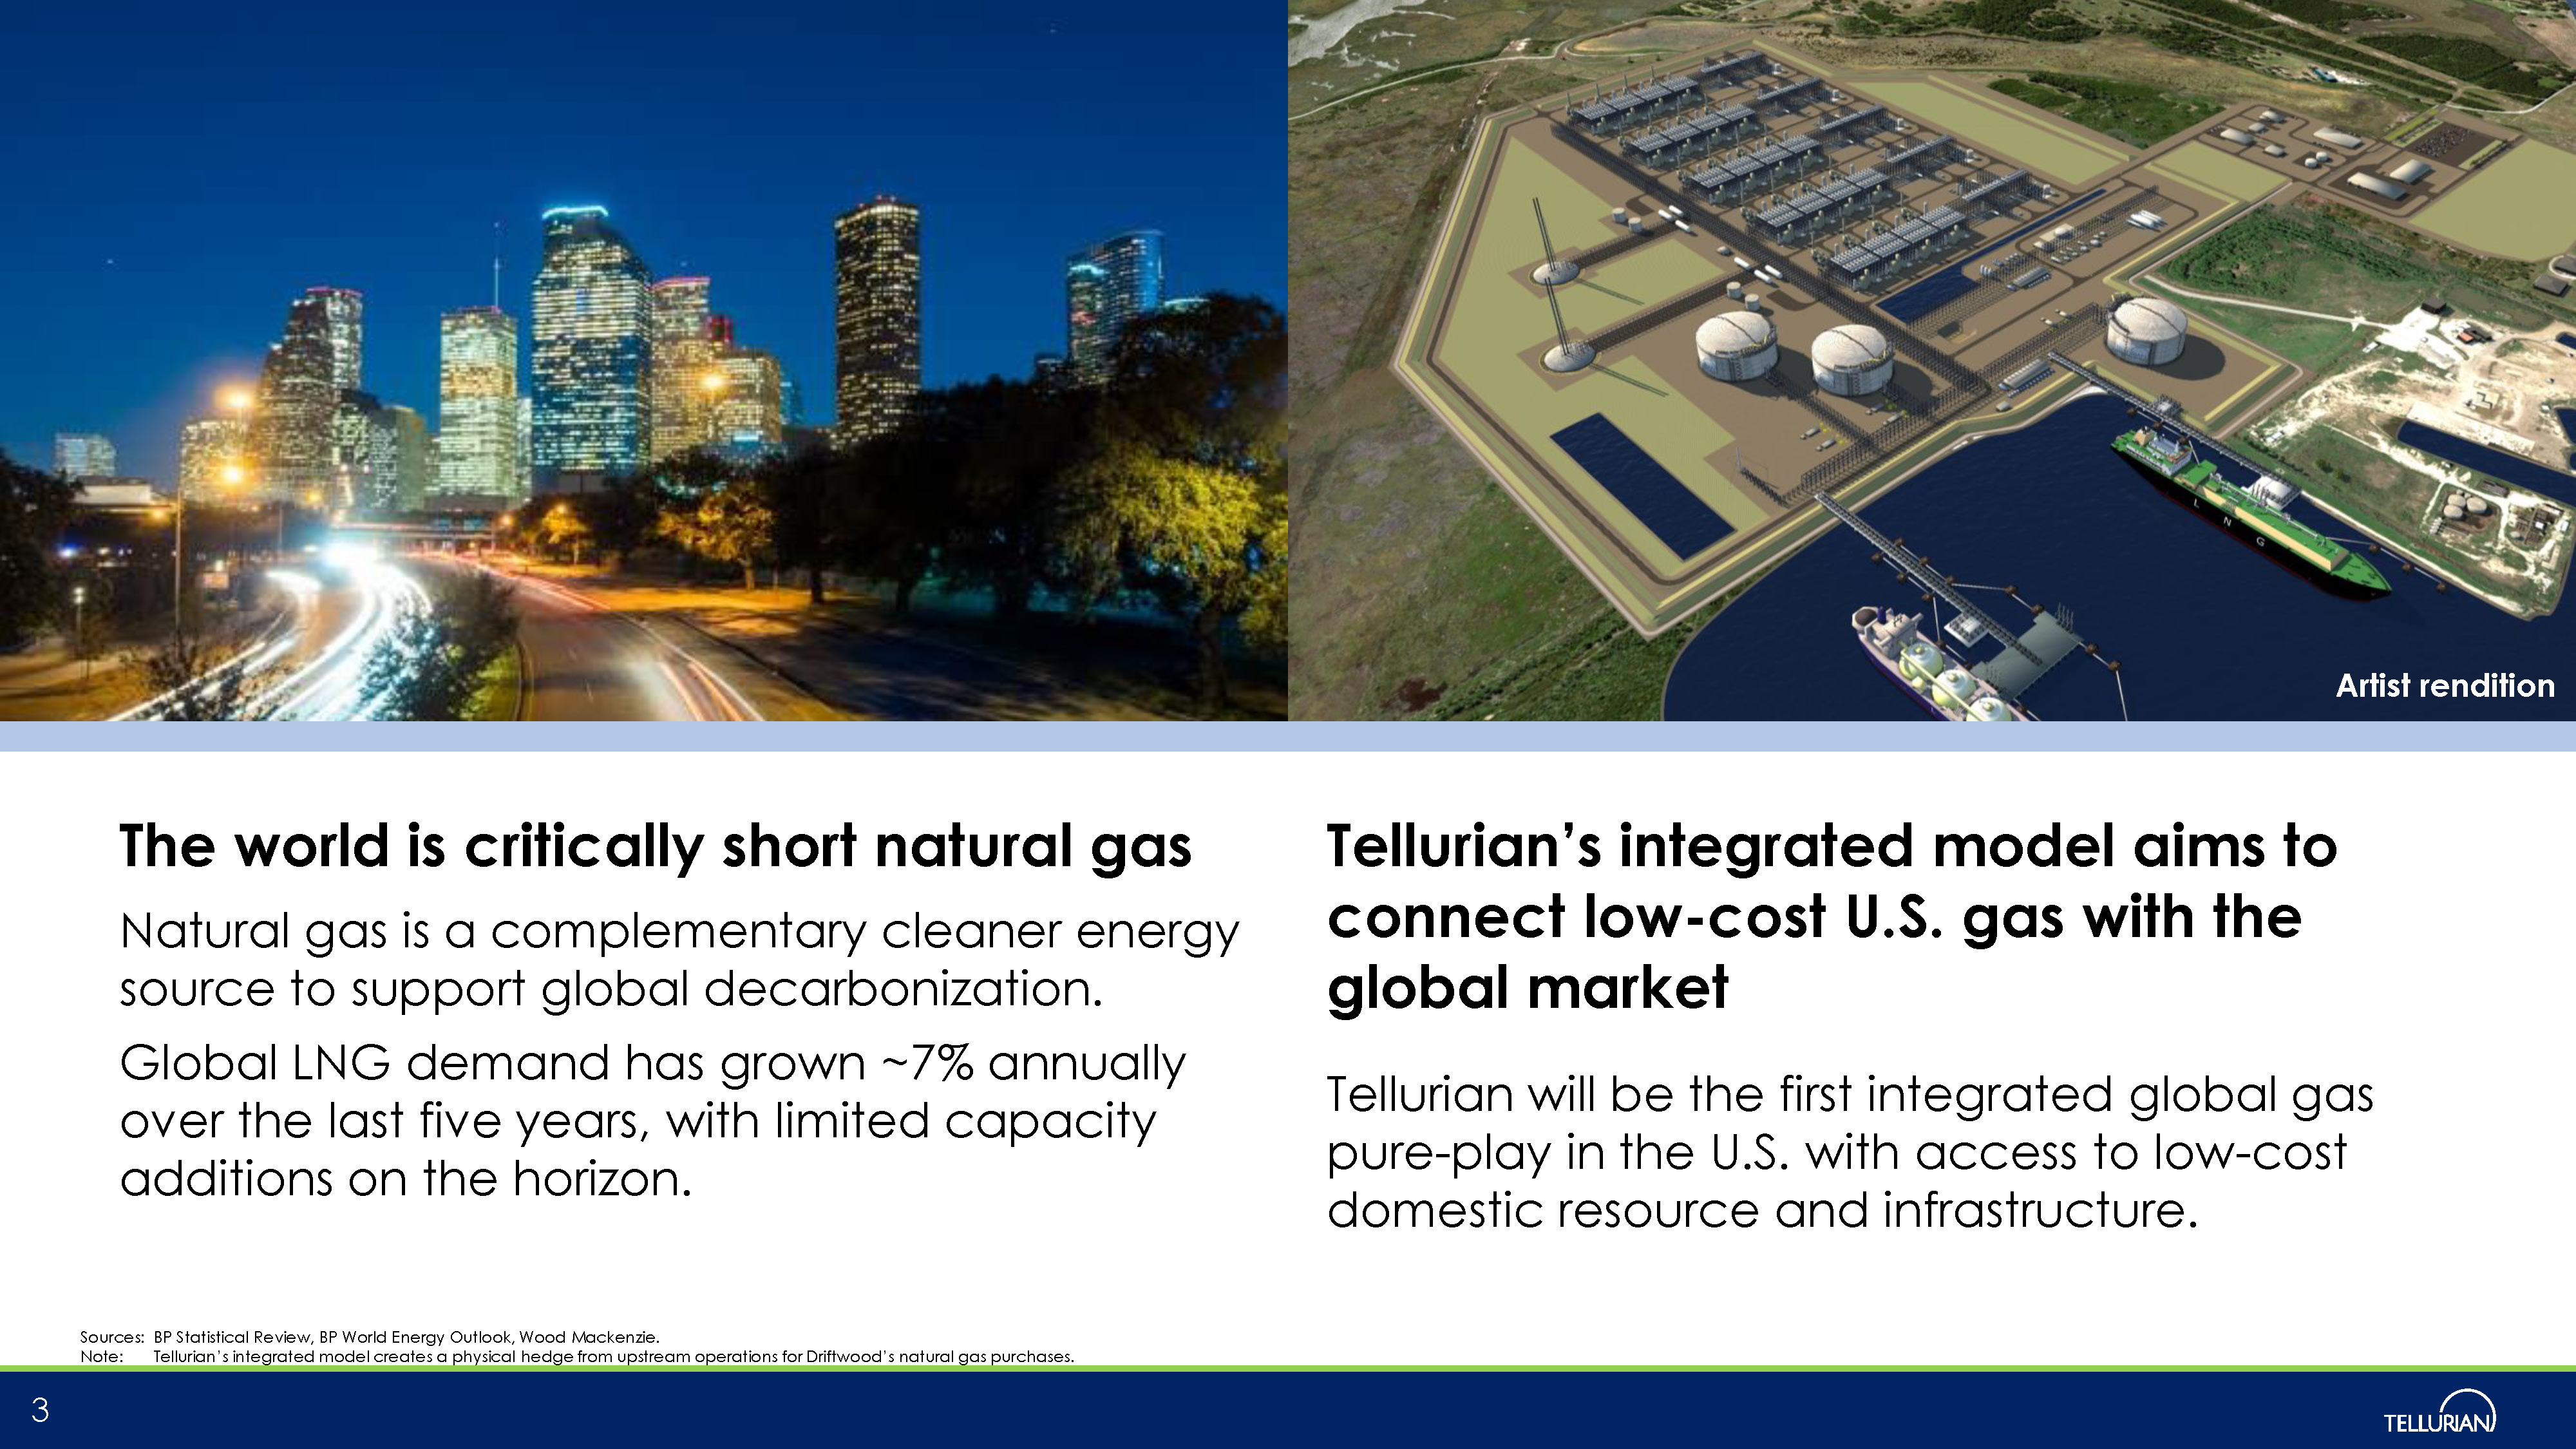
| The world is critically short natural gas Natural gas is a complementary cleaner energy source to support global decarbonization. Global LNG demand has grown ~7% annually over the last five years, with limited capacity additions on the horizon. Tellurian’s integrated model aims to connect low-cost U.S. gas with the global market Tellurian will be the first integrated global gas pure-play in the U.S. with access to low-cost domestic resource and infrastructure. Sources: BP Statistical Review, BP World Energy Outlook, Wood Mackenzie. Note: Tellurian’s integrated model creates a physical hedge from upstream operations for Driftwood’s natural gas purchases. 3 |
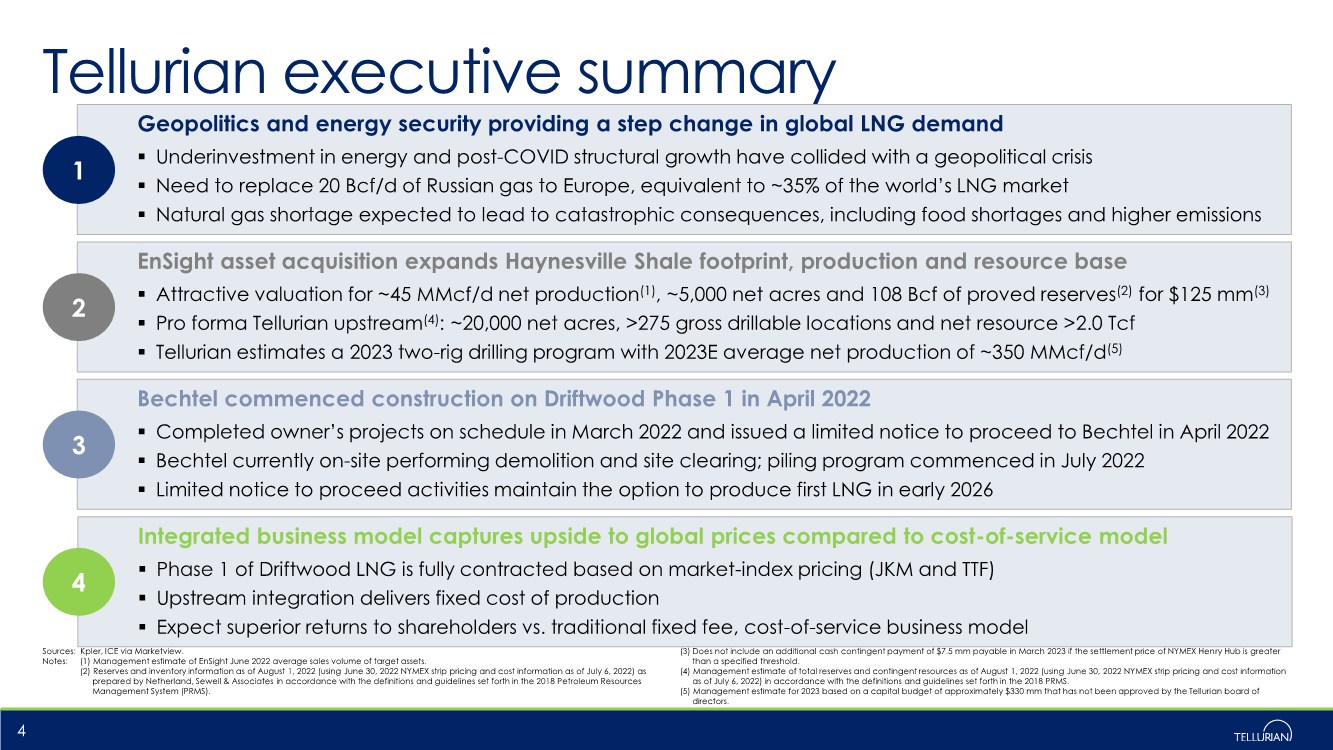
| Tellurian executive summary 4 Bechtel commenced construction on Driftwood Phase 1 in April 2022 ▪ Completed owner’s projects on schedule in March 2022 and issued a limited notice to proceed to Bechtel in April 2022 ▪ Bechtel currently on-site performing demolition and site clearing; piling program commenced in July 2022 ▪ Limited notice to proceed activities maintain the option to produce first LNG in early 2026 Geopolitics and energy security providing a step change in global LNG demand ▪ Underinvestment in energy and post-COVID structural growth have collided with a geopolitical crisis ▪ Need to replace 20 Bcf/d of Russian gas to Europe, equivalent to ~35% of the world’s LNG market ▪ Natural gas shortage expected to lead to catastrophic consequences, including food shortages and higher emissions EnSight asset acquisition expands Haynesville Shale footprint, production and resource base ▪ Attractive valuation for ~45 MMcf/d net production(1), ~5,000 net acres and 108 Bcf of proved reserves(2) for $125 mm(3) ▪ Pro forma Tellurian upstream(4): ~20,000 net acres, >275 gross drillable locations and net resource >2.0 Tcf ▪ Tellurian estimates a 2023 two-rig drilling program with 2023E average net production of ~350 MMcf/d(5) Integrated business model captures upside to global prices compared to cost-of-service model ▪ Phase 1 of Driftwood LNG is fully contracted based on market-index pricing (JKM and TTF) ▪ Upstream integration delivers fixed cost of production ▪ Expect superior returns to shareholders vs. traditional fixed fee, cost-of-service business model 1 2 3 4 Sources: Kpler, ICE via Marketview. Notes: (1) Management estimate of EnSight June 2022 average sales volume of target assets. (2) Reserves and inventory information as of August 1, 2022 (using June 30, 2022 NYMEX strip pricing and cost information as of July 6, 2022) as prepared by Netherland, Sewell & Associates in accordance with the definitions and guidelines set forth in the 2018 Petroleum Resources Management System (PRMS). (3) Does not include an additional cash contingent payment of $7.5 mm payable in March 2023 if the settlement price of NYMEX Henry Hub is greater than a specified threshold. (4) Management estimate of total reserves and contingent resources as of August 1, 2022 (using June 30, 2022 NYMEX strip pricing and cost information as of July 6, 2022) in accordance with the definitions and guidelines set forth in the 2018 PRMS. (5) Management estimate for 2023 based on a capital budget of approximately $330 mm that has not been approved by the Tellurian board of directors. |
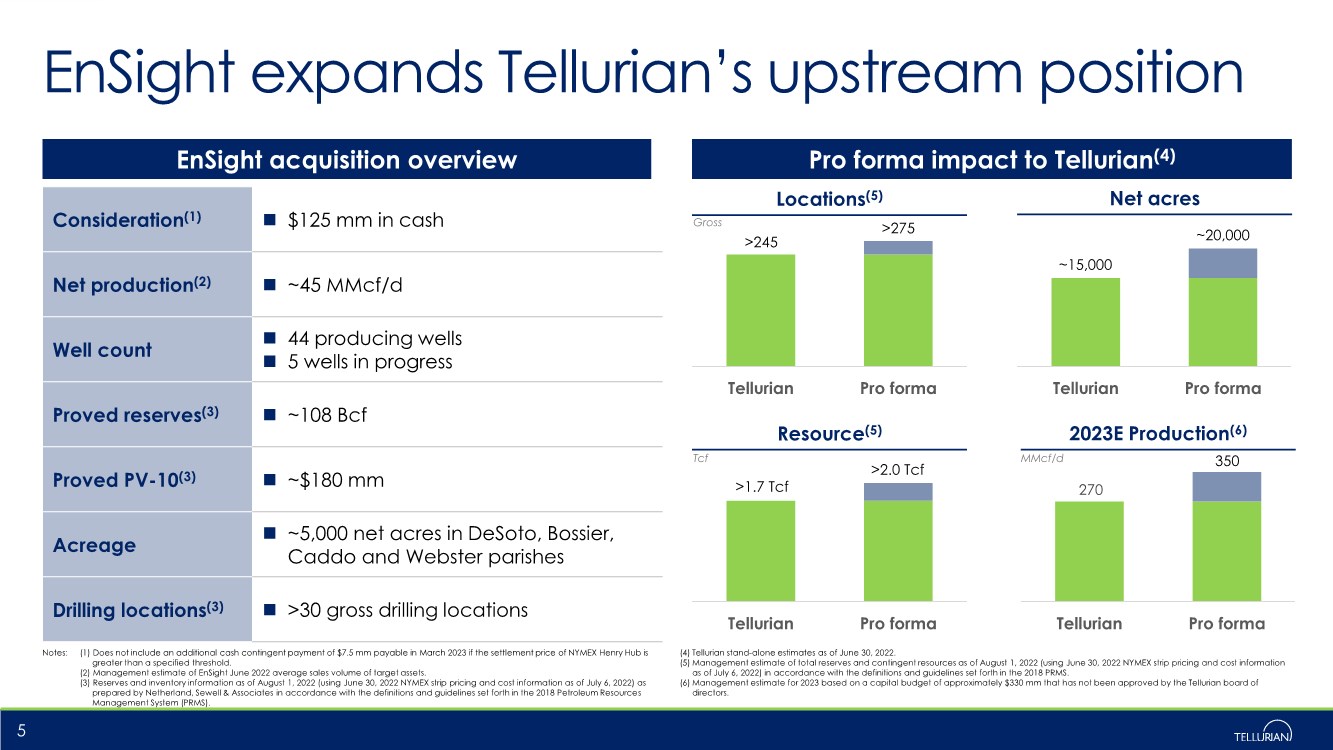
| EnSight expands Tellurian’s upstream position Consideration(1) ◼ $125 mm in cash Net production(2) ◼ ~45 MMcf/d Well count ◼ 44 producing wells ◼ 5 wells in progress Proved reserves(3) ◼ ~108 Bcf Proved PV-10(3) ◼ ~$180 mm Acreage ◼ ~5,000 net acres in DeSoto, Bossier, Caddo and Webster parishes Drilling locations(3) ◼ >30 gross drilling locations Notes: (1) Does not include an additional cash contingent payment of $7.5 mm payable in March 2023 if the settlement price of NYMEX Henry Hub is greater than a specified threshold. (2) Management estimate of EnSight June 2022 average sales volume of target assets. (3) Reserves and inventory information as of August 1, 2022 (using June 30, 2022 NYMEX strip pricing and cost information as of July 6, 2022) as prepared by Netherland, Sewell & Associates in accordance with the definitions and guidelines set forth in the 2018 Petroleum Resources Management System (PRMS). (4) Tellurian stand-alone estimates as of June 30, 2022. (5) Management estimate of total reserves and contingent resources as of August 1, 2022 (using June 30, 2022 NYMEX strip pricing and cost information as of July 6, 2022) in accordance with the definitions and guidelines set forth in the 2018 PRMS. (6) Management estimate for 2023 based on a capital budget of approximately $330 mm that has not been approved by the Tellurian board of directors. 5 Pro forma impact to Tellurian(4) EnSight acquisition overview Locations(5) Tellurian Pro forma Net acres Resource(5) 2023E Production(6) Tellurian Pro forma Tellurian Pro forma 270 Tellurian Pro forma ~15,000 350 Tcf MMcf/d >275 >245 ~20,000 >1.7 Tcf >2.0 Tcf Gross |
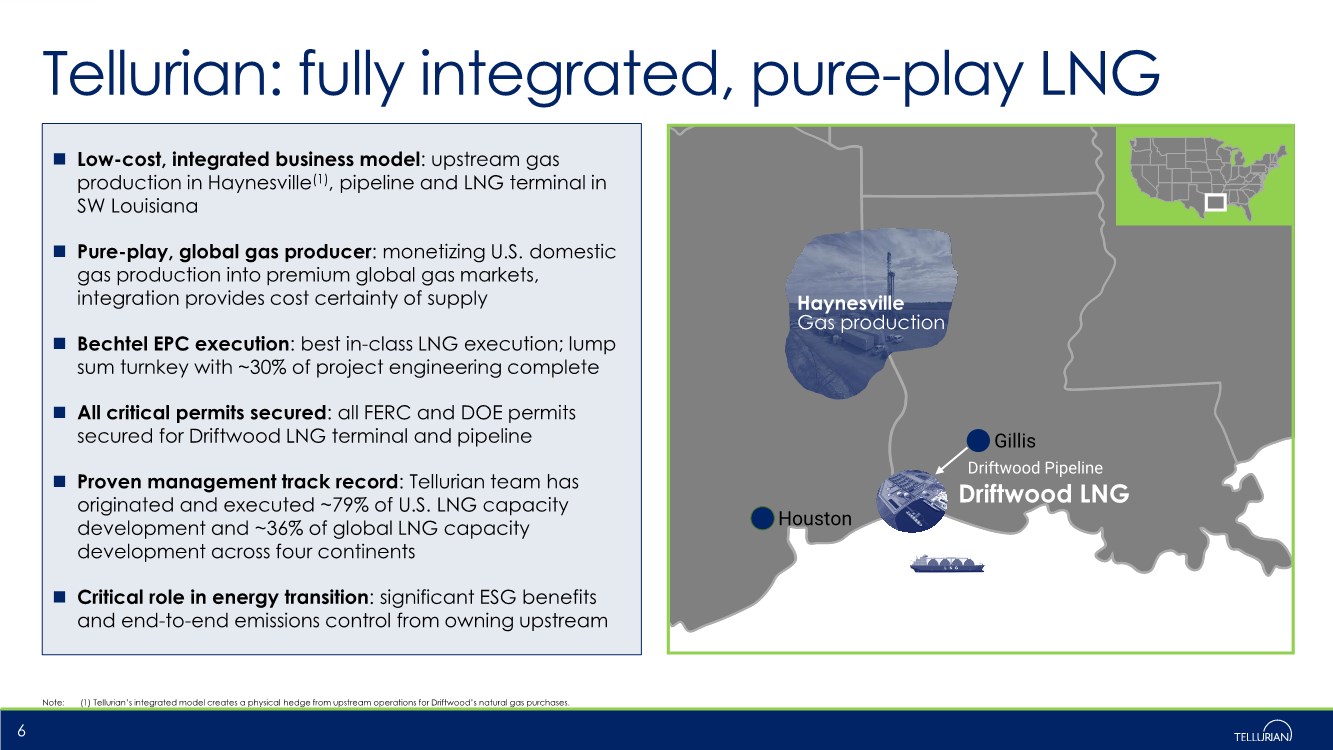
| Houston Gillis Haynesville Gas production Driftwood LNG Driftwood Pipeline Tellurian: fully integrated, pure-play LNG 6 ◼ Low-cost, integrated business model: upstream gas production in Haynesville(1), pipeline and LNG terminal in SW Louisiana ◼ Pure-play, global gas producer: monetizing U.S. domestic gas production into premium global gas markets, integration provides cost certainty of supply ◼ Bechtel EPC execution: best in-class LNG execution; lump sum turnkey with ~30% of project engineering complete ◼ All critical permits secured: all FERC and DOE permits secured for Driftwood LNG terminal and pipeline ◼ Proven management track record: Tellurian team has originated and executed ~79% of U.S. LNG capacity development and ~36% of global LNG capacity development across four continents ◼ Critical role in energy transition: significant ESG benefits and end-to-end emissions control from owning upstream Note: (1) Tellurian’s integrated model creates a physical hedge from upstream operations for Driftwood’s natural gas purchases. |
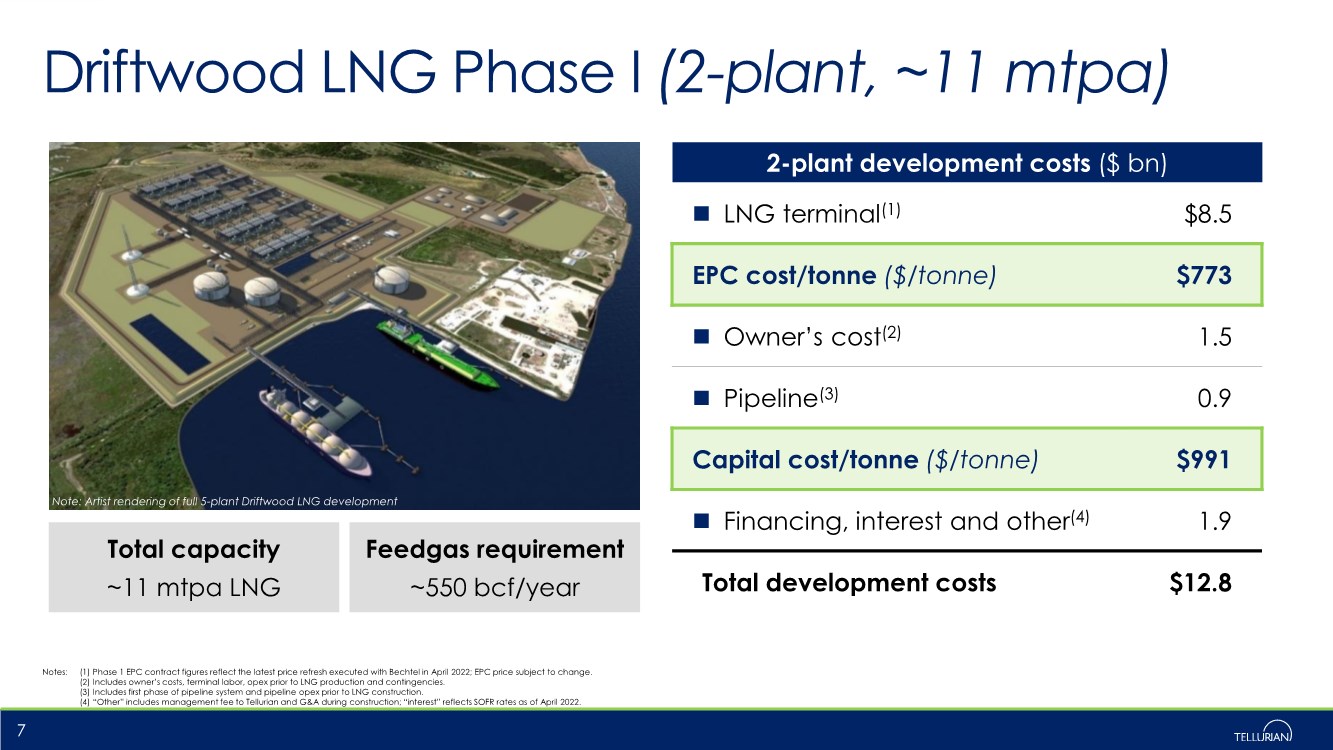
| Driftwood LNG Phase I (2-plant, ~11 mtpa) Notes: (1) Phase 1 EPC contract figures reflect the latest price refresh executed with Bechtel in April 2022; EPC price subject to change. (2) Includes owner’s costs, terminal labor, opex prior to LNG production and contingencies. (3) Includes first phase of pipeline system and pipeline opex prior to LNG construction. (4) “Other” includes management fee to Tellurian and G&A during construction; “interest” reflects SOFR rates as of April 2022. 7 2-plant development costs ($ bn) ◼ LNG terminal(1) $8.5 EPC cost/tonne ($/tonne) $773 ◼ Owner’s cost(2) 1.5 ◼ Pipeline(3) 0.9 Capital cost/tonne ($/tonne) $991 ◼ Financing, interest and other(4) 1.9 Total development costs $12.8 Total capacity ~11 mtpa LNG Feedgas requirement ~550 bcf/year Note: Artist rendering of full 5-plant Driftwood LNG development |
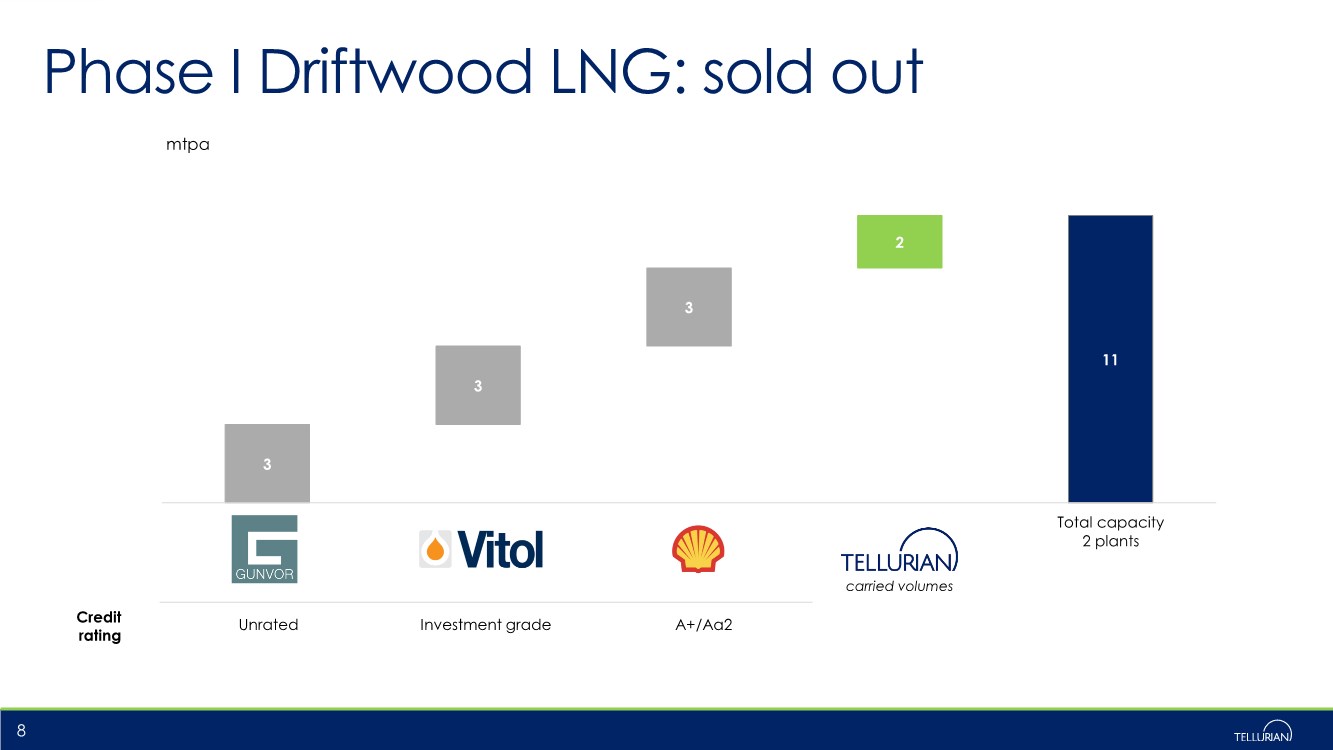
| 3 11 3 3 2 Total capacity 2 plants Credit rating Unrated Investment grade A+/Aa2 8 carried volumes mtpa Phase I Driftwood LNG: sold out |
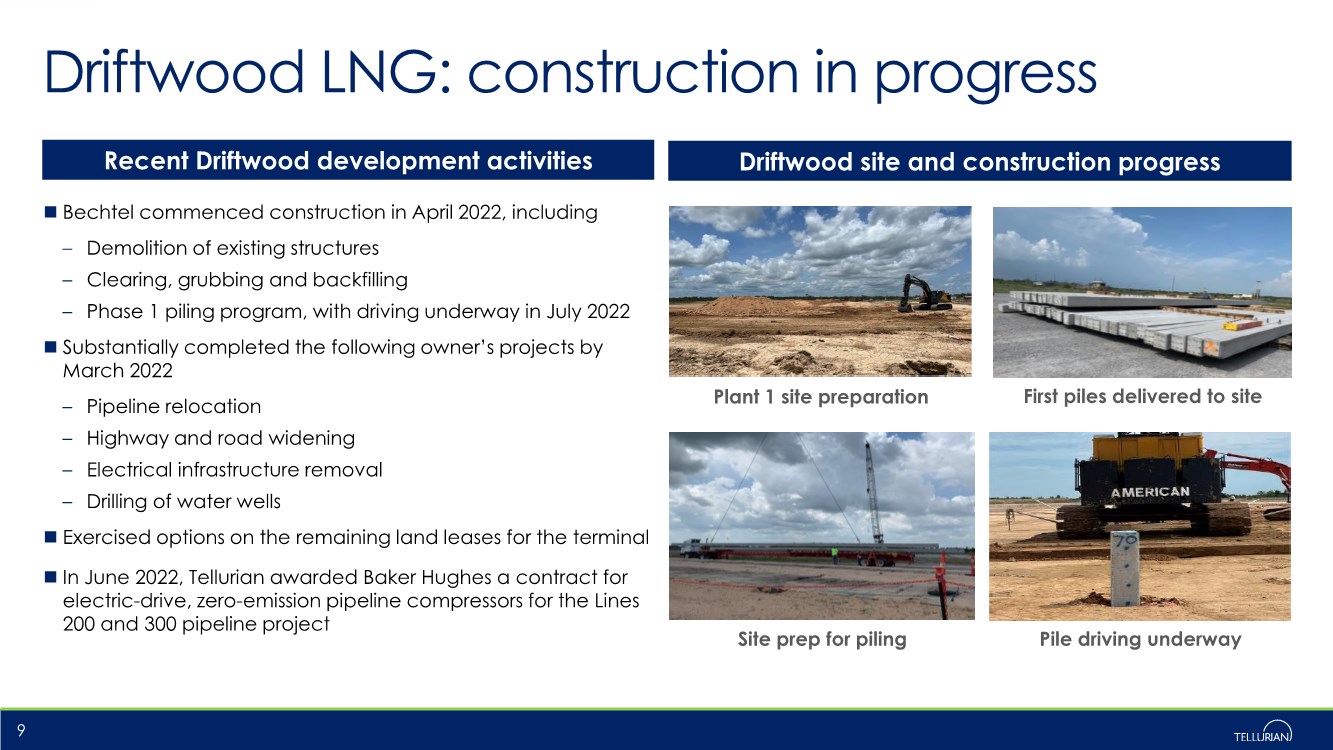
| Driftwood LNG: construction in progress ◼ Bechtel commenced construction in April 2022, including – Demolition of existing structures – Clearing, grubbing and backfilling – Phase 1 piling program, with driving underway in July 2022 ◼ Substantially completed the following owner’s projects by March 2022 – Pipeline relocation – Highway and road widening – Electrical infrastructure removal – Drilling of water wells ◼ Exercised options on the remaining land leases for the terminal ◼ In June 2022, Tellurian awarded Baker Hughes a contract for electric-drive, zero-emission pipeline compressors for the Lines 200 and 300 pipeline project 9 Driftwood site and construction progress Recent Driftwood development activities Pile driving underway Site prep for piling Plant 1 site preparation First piles delivered to site |
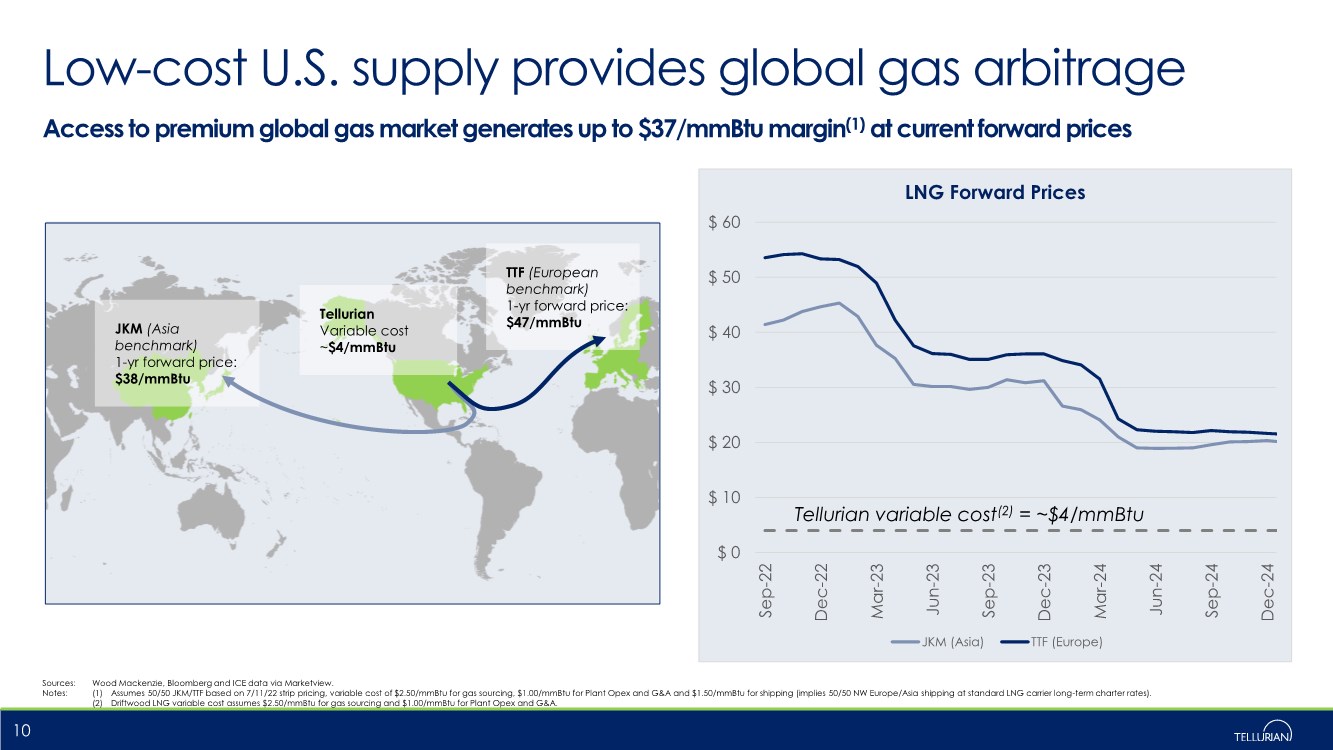
| $ 0 $ 10 $ 20 $ 30 $ 40 $ 50 $ 60 Sep-22 Dec-22 Mar-23 Jun-23 Sep-23 Dec-23 Mar-24 Jun-24 Sep-24 Dec-24 LNG Forward Prices JKM (Asia) TTF (Europe) Low-cost U.S. supply provides global gas arbitrage 10 Access to premium global gas market generates up to $37/mmBtu margin(1) at current forward prices JKM (Asia benchmark) 1-yr forward price: $38/mmBtu TTF (European benchmark) 1-yr forward price: $47/mmBtu Tellurian Variable cost ~$4/mmBtu Sources: Wood Mackenzie, Bloomberg and ICE data via Marketview. Notes: (1) Assumes 50/50 JKM/TTF based on 7/11/22 strip pricing, variable cost of $2.50/mmBtu for gas sourcing, $1.00/mmBtu for Plant Opex and G&A and $1.50/mmBtu for shipping (implies 50/50 NW Europe/Asia shipping at standard LNG carrier long-term charter rates). (2) Driftwood LNG variable cost assumes $2.50/mmBtu for gas sourcing and $1.00/mmBtu for Plant Opex and G&A. Tellurian variable cost(2) = ~$4/mmBtu |
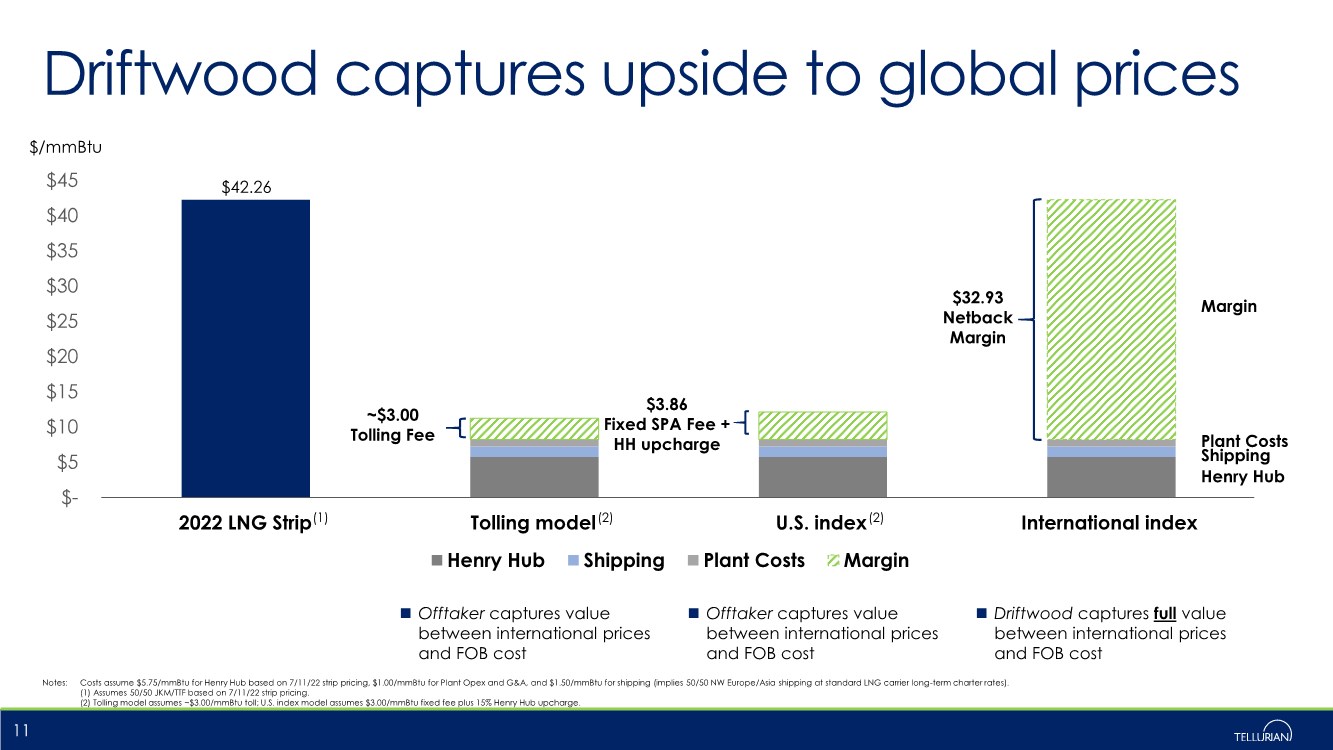
| 2022 LNG Strip Tolling model U.S. index International index ◼ Offtaker captures value between international prices and FOB cost ◼ Offtaker captures value between international prices and FOB cost ◼ Driftwood captures full value between international prices and FOB cost 11 Notes: Costs assume $5.75/mmBtu for Henry Hub based on 7/11/22 strip pricing, $1.00/mmBtu for Plant Opex and G&A, and $1.50/mmBtu for shipping (implies 50/50 NW Europe/Asia shipping at standard LNG carrier long-term charter rates). (1) Assumes 50/50 JKM/TTF based on 7/11/22 strip pricing. (2) Tolling model assumes ~$3.00/mmBtu toll; U.S. index model assumes $3.00/mmBtu fixed fee plus 15% Henry Hub upcharge. Driftwood captures upside to global prices $- $5 $10 $15 $20 $25 $30 $35 $40 $45 Henry Hub Shipping Plant Costs Margin $/mmBtu $32.93 Netback Margin $42.26 ~$3.00 Tolling Fee $3.86 Fixed SPA Fee + HH upcharge Henry Hub Shipping Margin Plant Costs (1) (2) (2) |
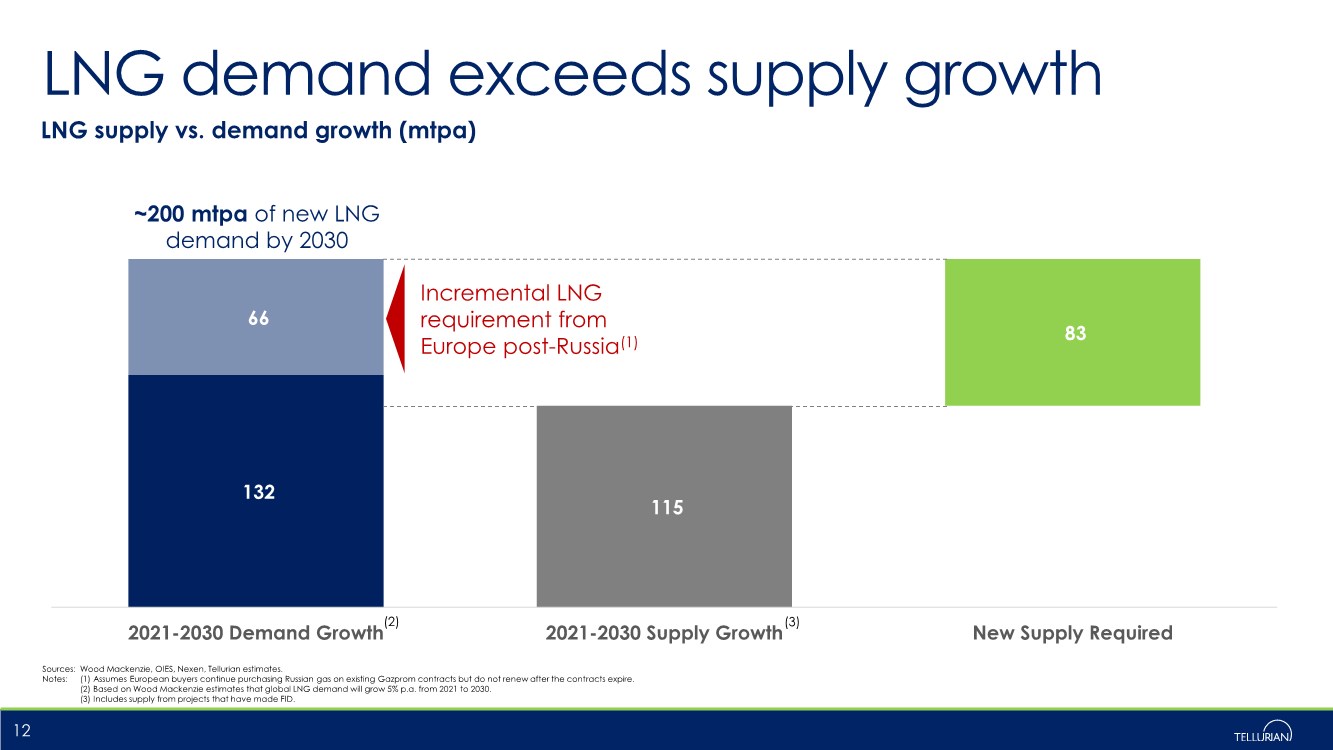
| 132 115 66 83 2021-2030 Demand Growth 2021-2030 Supply Growth New Supply Required LNG supply vs. demand growth (mtpa) LNG demand exceeds supply growth 12 Sources: Wood Mackenzie, OIES, Nexen, Tellurian estimates. Notes: (1) Assumes European buyers continue purchasing Russian gas on existing Gazprom contracts but do not renew after the contracts expire. (2) Based on Wood Mackenzie estimates that global LNG demand will grow 5% p.a. from 2021 to 2030. (3) Includes supply from projects that have made FID. Incremental LNG requirement from Europe post-Russia(1) (2) (3) ~200 mtpa of new LNG demand by 2030 |
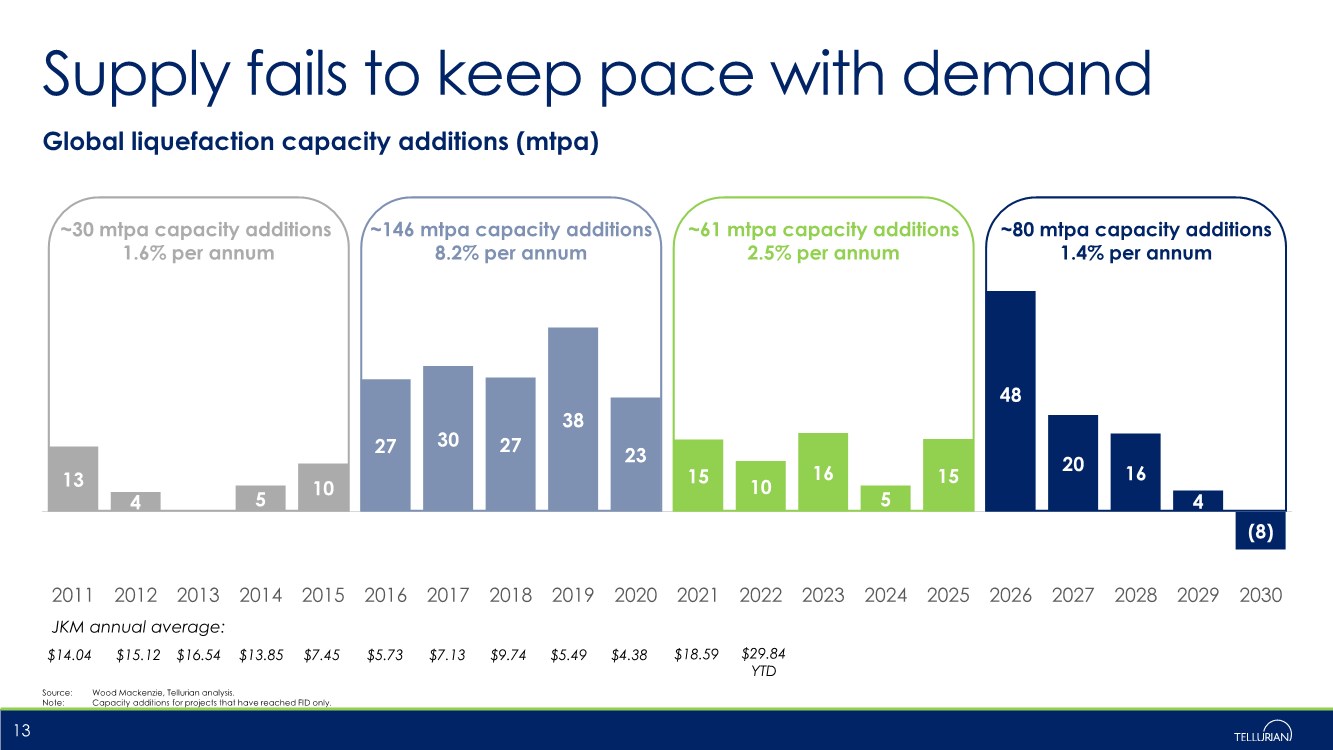
| Supply fails to keep pace with demand Source: Wood Mackenzie, Tellurian analysis. Note: Capacity additions for projects that have reached FID only. 13 13 4 5 10 27 30 27 38 23 15 10 16 5 15 48 20 16 4 (8) 2011 2012 2013 2014 2015 2016 2017 2018 2019 2020 2021 2022 2023 2024 2025 2026 2027 2028 2029 2030 ~146 mtpa capacity additions 8.2% per annum ~80 mtpa capacity additions 1.4% per annum Global liquefaction capacity additions (mtpa) ~61 mtpa capacity additions 2.5% per annum ~30 mtpa capacity additions 1.6% per annum $14.04 $15.12 $16.54 $13.85 $7.45 $5.73 $7.13 $9.74 $5.49 JKM annual average: $4.38 $18.59 $29.84 YTD |
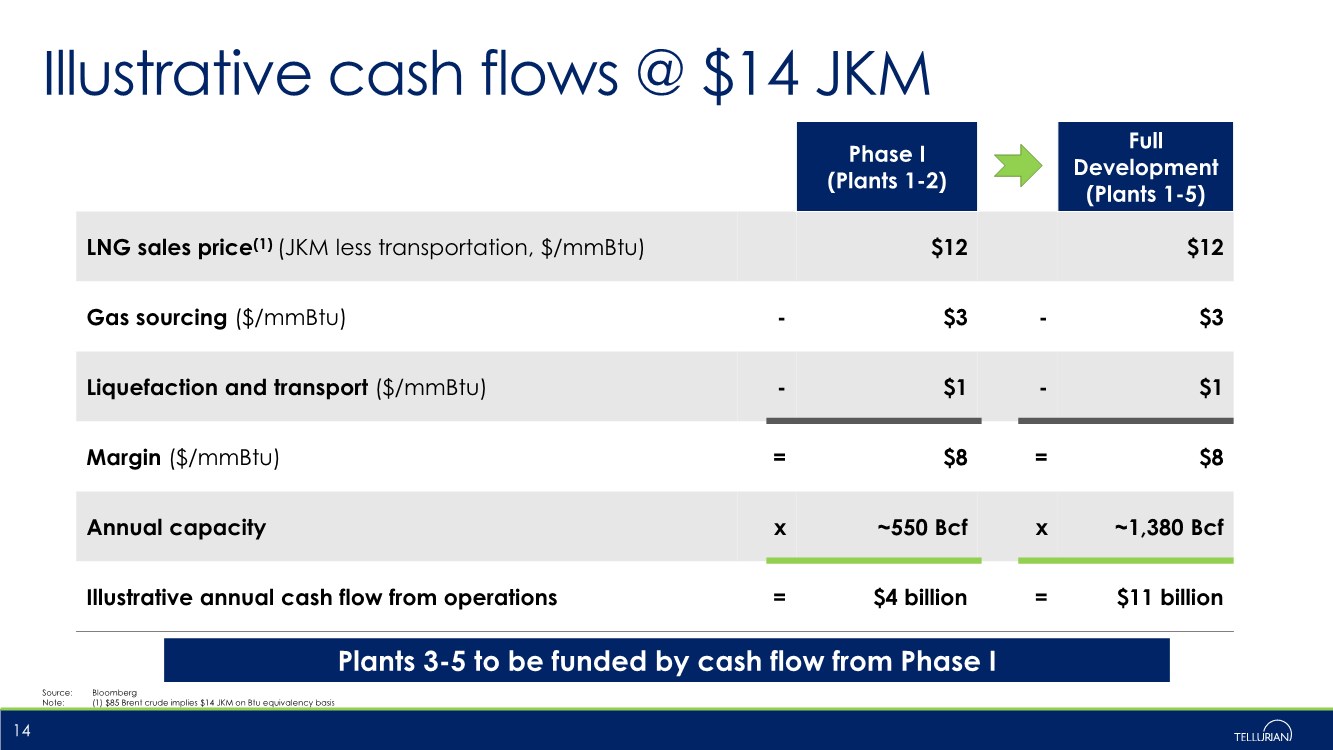
| Illustrative cash flows @ $14 JKM Source: Bloomberg Note: (1) $85 Brent crude implies $14 JKM on Btu equivalency basis 14 Phase I (Plants 1-2) Full Development (Plants 1-5) LNG sales price(1) (JKM less transportation, $/mmBtu) $12 $12 Gas sourcing ($/mmBtu) - $3 - $3 Liquefaction and transport ($/mmBtu) - $1 - $1 Margin ($/mmBtu) = $8 = $8 Annual capacity x ~550 Bcf x ~1,380 Bcf Illustrative annual cash flow from operations = $4 billion = $11 billion Plants 3-5 to be funded by cash flow from Phase I |
| Contact us ▪ Matt Phillips VP, Investor Relations & Finance +1 832 320 9331 matthew.phillips@tellurianinc.com ▪ Joi Lecznar EVP, Public & Government Affairs +1 832 962 4044 joi.lecznar@tellurianinc.com 15 ▪ Johan Yokay Director, Investor Relations & Assistant Treasurer +1 832 320 9327 johan.yokay@tellurianinc.com |

| Appendix |

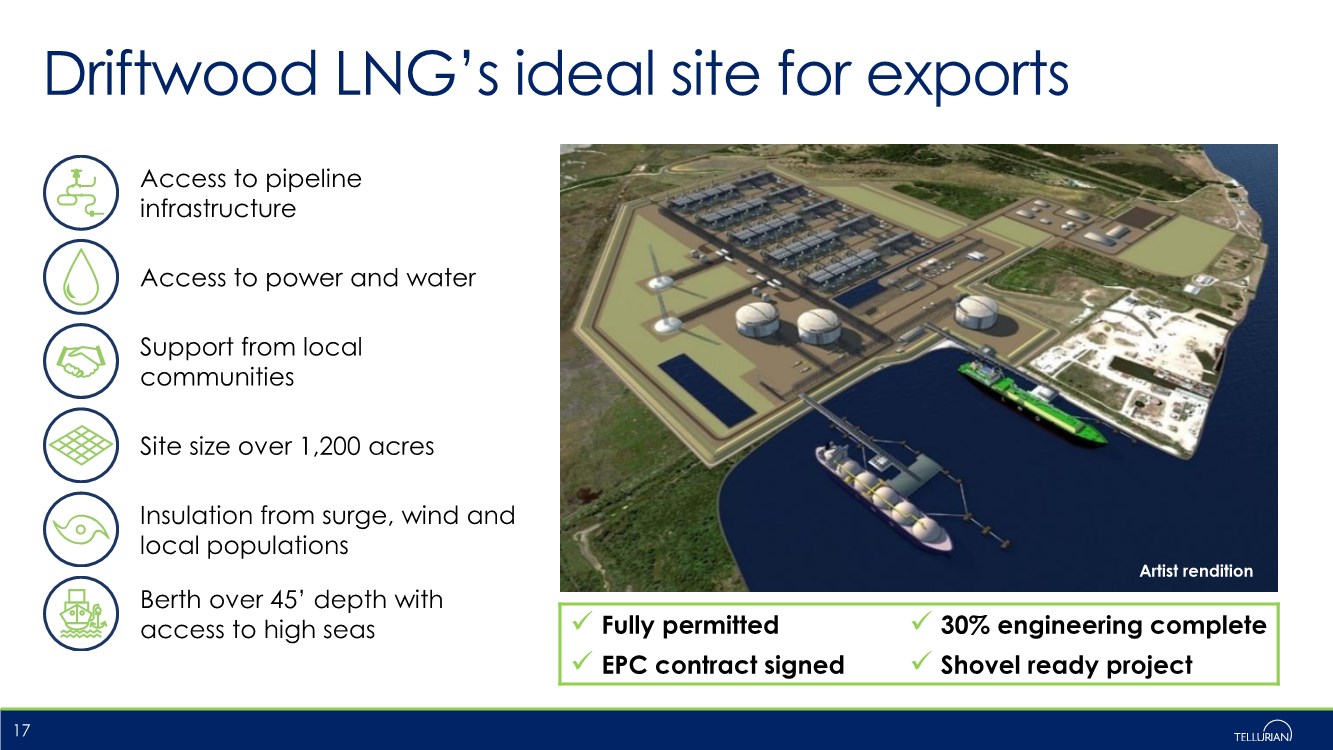
| Driftwood LNG’s ideal site for exports 17 Access to power and water Berth over 45’ depth with access to high seas Support from local communities Access to pipeline infrastructure Site size over 1,200 acres Insulation from surge, wind and local populations Artist rendition ✓ Fully permitted ✓ 30% engineering complete ✓ EPC contract signed ✓ Shovel ready project |
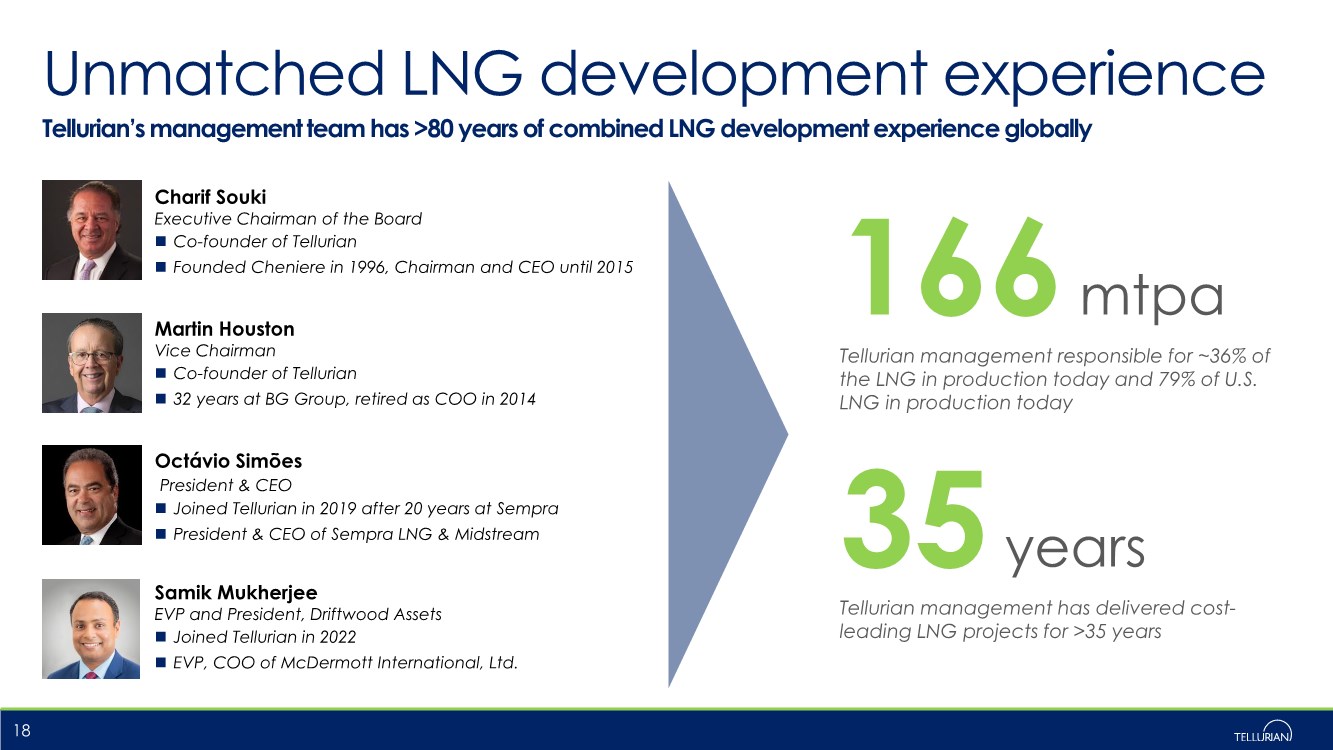
| Unmatched LNG development experience Tellurian’s management team has >80 years of combined LNG development experience globally 18 Charif Souki Executive Chairman of the Board ◼ Co-founder of Tellurian ◼ Founded Cheniere in 1996, Chairman and CEO until 2015 Martin Houston Vice Chairman ◼ Co-founder of Tellurian ◼ 32 years at BG Group, retired as COO in 2014 Octávio Simões President & CEO ◼ Joined Tellurian in 2019 after 20 years at Sempra ◼ President & CEO of Sempra LNG & Midstream 166 mtpa Tellurian management responsible for ~36% of the LNG in production today and 79% of U.S. LNG in production today 35 years Tellurian management has delivered cost- leading LNG projects for >35 years Samik Mukherjee EVP and President, Driftwood Assets ◼ Joined Tellurian in 2022 ◼ EVP, COO of McDermott International, Ltd. |