Exhibit 99.1

Exhibit 99.1
Tellurian Inc. August 2021 Corporate presentation |
| Cautionary statements The information in this presentation includes “forward-looking statements” within the meaning of Section 27A of the Securities Act of 1933, as amended, and Section 21E of the Securities Exchange Act of 1934, as amended. All statements other than statements of historical fact are forward-looking statements. The words “anticipate,” “assume,” “believe,” “budget,” “estimate,” “expect,” “forecast,” “initial,” “intend,” “may,” “model,” “plan,” “potential,” “project,” “should,” “will,” “would,” and similar expressions are intended to identify forward-looking statements. The forward- looking statements in this presentation relate to, among other things, future revenues, production, costs, prices, margins, cash flow, rates of return and payback periods, emissions and other environmental matters, financing transactions, contracts, liquefaction capacity additions, financing discussions, timing for FID, notice to proceed, future demand and supply affecting LNG and general energy markets, future transactions and other aspects of our business and our prospects and those of other industry participants. Our forward-looking statements are based on assumptions and analyses made by us in light of our experience and our perception of historical trends, current conditions, expected future developments, and other factors that we believe are appropriate under the circumstances. These statements are subject to numerous known and unknown risks and uncertainties which may cause actual results to be materially different from any future results or performance expressed or implied by the forward-looking statements. These risks and uncertainties include those described in the “Risk Factors” section of our Annual Report on Form 10-K for the fiscal year ended December 31, 2020, and our other filings with the Securities and Exchange Commission, which are incorporated by reference in this presentation. Many of the forward-looking statements in this presentation relate to events or developments anticipated to occur numerous years in the future, which increases the likelihood that actual results will differ materially from those indicated in such forward-looking statements. We may not be able to complete the anticipated transactions described in this presentation. FID is subject to the completion of financing arrangements that may not be completed within the time frame expected or at all. The financial information included on slides 5, 9, 10, 11 and 36 is meant for illustrative purposes only and does not purport to show estimates of actual future financial performance. The information on those slides assumes the completion of certain acquisition, financing and other transactions. Such transactions may not be completed on the assumed terms or at all. Actual commodity prices may vary materially from the commodity prices assumed for the purposes of the illustrative financial performance information. Estimates of “resources” and other non-proved reserves are subject to substantially greater risk than are estimates of proved reserves. The forward-looking statements made in or in connection with this presentation speak only as of the date hereof. Although we may from time to time voluntarily update our prior forward-looking statements, we disclaim any commitment to do so except as required by securities laws. Forward-looking statements 2 |
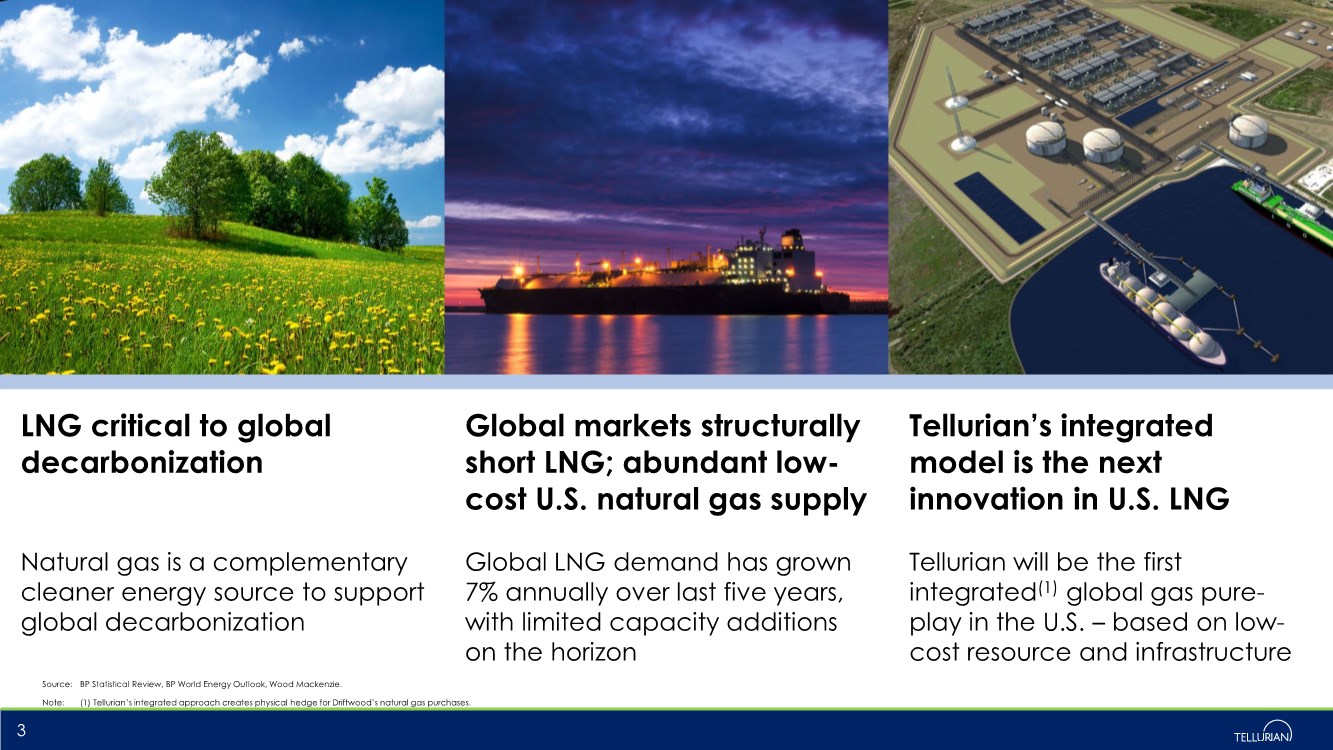
| LNG critical to global decarbonization Source: BP Statistical Review, BP World Energy Outlook, Wood Mackenzie. Note: (1) Tellurian’s integrated approach creates physical hedge for Driftwood’s natural gas purchases. Global markets structurally short LNG; abundant low- cost U.S. natural gas supply Tellurian’s integrated model is the next innovation in U.S. LNG Natural gas is a complementary cleaner energy source to support global decarbonization Global LNG demand has grown 7% annually over last five years, with limited capacity additions on the horizon Tellurian will be the first integrated(1) global gas pure- play in the U.S. – based on low- cost resource and infrastructure 3 |
| The integrated Tellurian model is the next innovation in U.S. LNG |
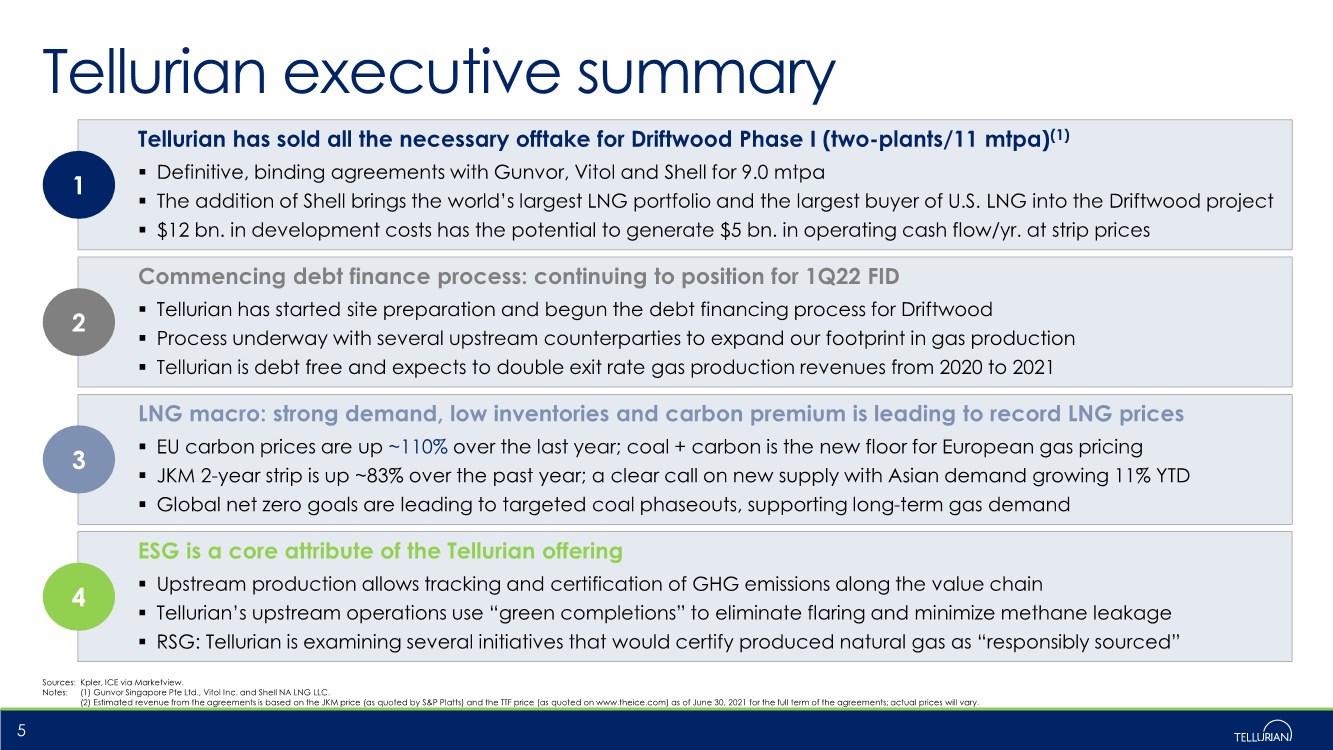
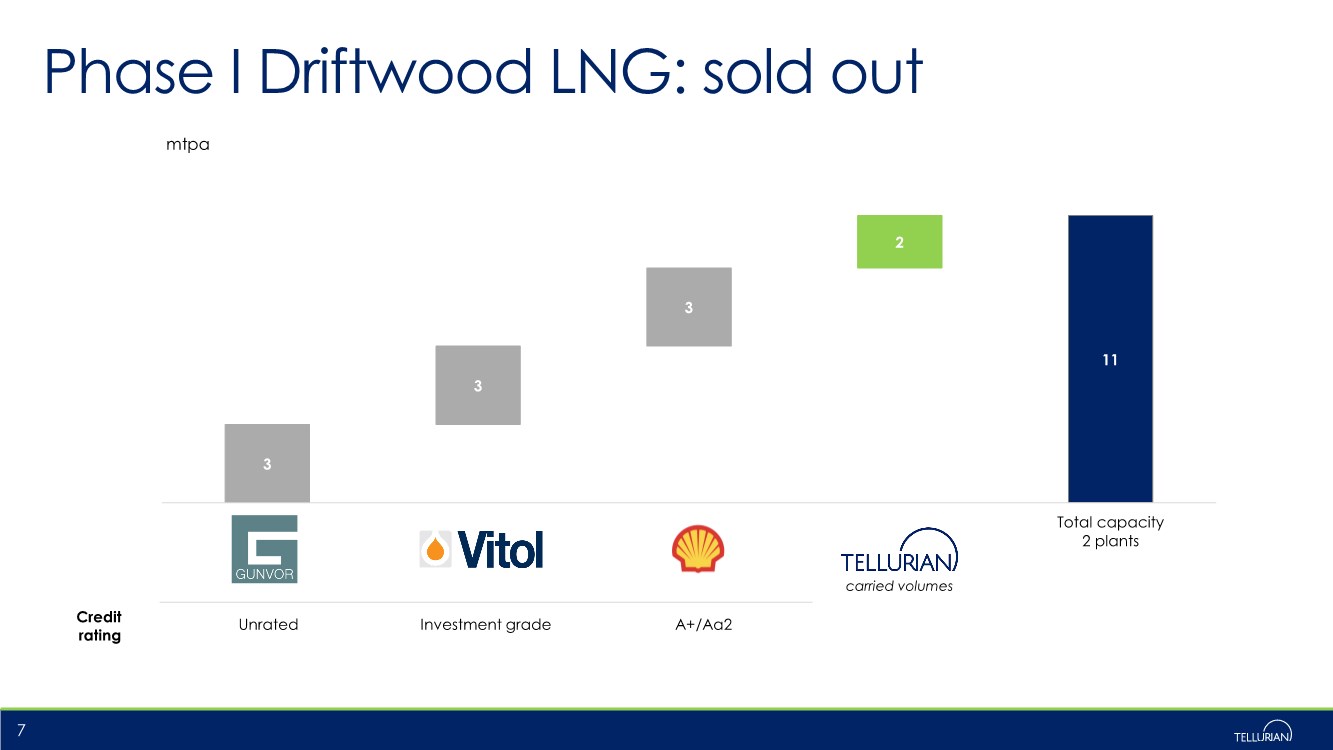
| Tellurian executive summary 5 Tellurian has sold all the necessary offtake for Driftwood Phase I (two-plants/11 mtpa)(1) .. Definitive, binding agreements with Gunvor, Vitol and Shell for 9.0 mtpa .. The addition of Shell brings the world’s largest LNG portfolio and the largest buyer of U.S. LNG into the Driftwood project .. $12 bn. in development costs has the potential to generate $5 bn. in operating cash flow/yr. at strip prices Commencing debt finance process: continuing to position for 1Q22 FID .. Tellurian has started site preparation and begun the debt financing process for Driftwood .. Process underway with several upstream counterparties to expand our footprint in gas production .. Tellurian is debt free and expects to double exit rate gas production revenues from 2020 to 2021 LNG macro: strong demand, low inventories and carbon premium is leading to record LNG prices .. EU carbon prices are up ~110% over the last year; coal + carbon is the new floor for European gas pricing .. JKM 2-year strip is up ~83% over the past year; a clear call on new supply with Asian demand growing 11% YTD .. Global net zero goals are leading to targeted coal phaseouts, supporting long-term gas demand ESG is a core attribute of the Tellurian offering .. Upstream production allows tracking and certification of GHG emissions along the value chain .. Tellurian’s upstream operations use “green completions” to eliminate flaring and minimize methane leakage .. RSG: Tellurian is examining several initiatives that would certify produced natural gas as “responsibly sourced” 1 2 3 4 Sources: Kpler, ICE via Marketview. Notes: (1) Gunvor Singapore Pte Ltd., Vitol Inc. and Shell NA LNG LLC. (2) Estimated revenue from the agreements is based on the JKM price (as quoted by S&P Platts) and the TTF price (as quoted on www.theice.com) as of June 30, 2021 for the full term of the agreements; actual prices will vary. |
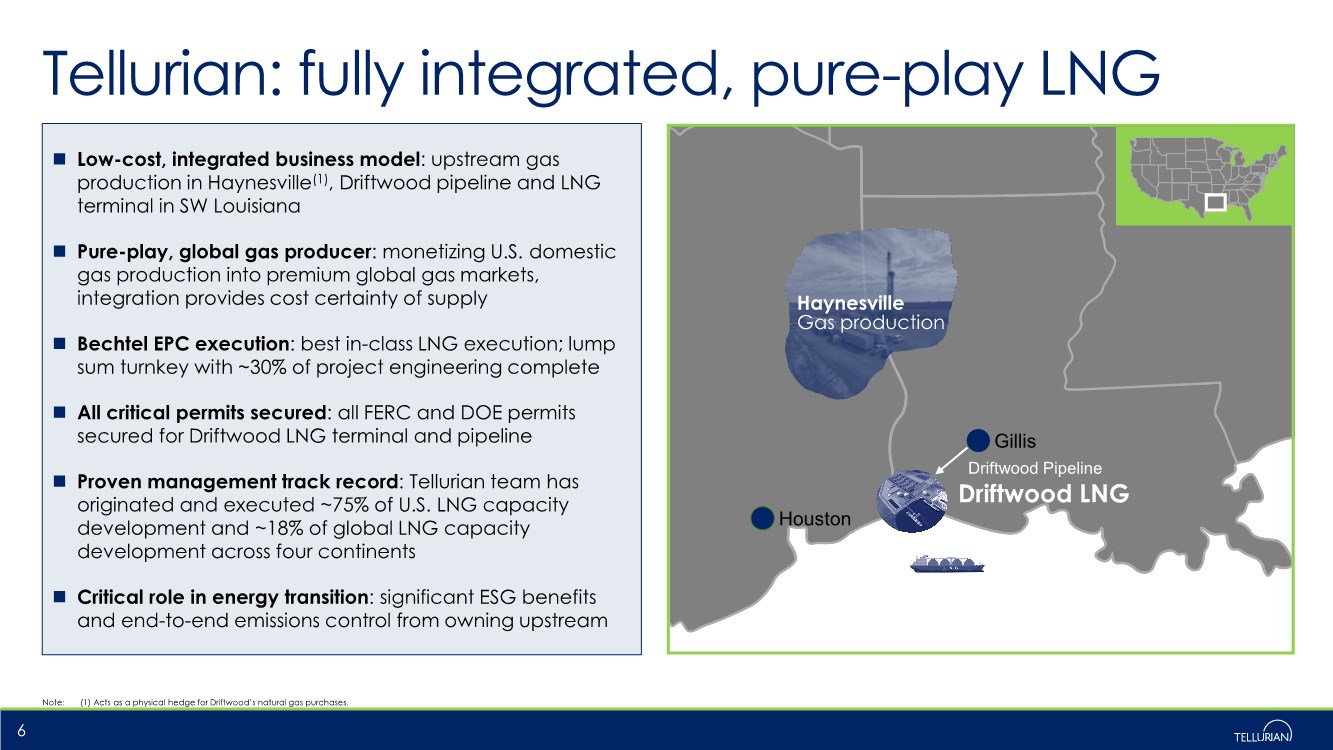
| Houston Gillis Haynesville Gas production Driftwood LNG Driftwood Pipeline Tellurian: fully integrated, pure-play LNG 6 Low-cost, integrated business model: upstream gas production in Haynesville(1), Driftwood pipeline and LNG terminal in SW Louisiana Pure-play, global gas producer: monetizing U.S. domestic gas production into premium global gas markets, integration provides cost certainty of supply Bechtel EPC execution: best in-class LNG execution; lump sum turnkey with ~30% of project engineering complete All critical permits secured: all FERC and DOE permits secured for Driftwood LNG terminal and pipeline Proven management track record: Tellurian team has originated and executed ~75% of U.S. LNG capacity development and ~18% of global LNG capacity development across four continents Critical role in energy transition: significant ESG benefits and end-to-end emissions control from owning upstream Note: (1) Acts as a physical hedge for Driftwood’s natural gas purchases. |
| 3 11 3 3 2 Total capacity 2 plants Credit rating Unrated Investment grade A+/Aa2 7 carried volumes mtpa Phase I Driftwood LNG: sold out |
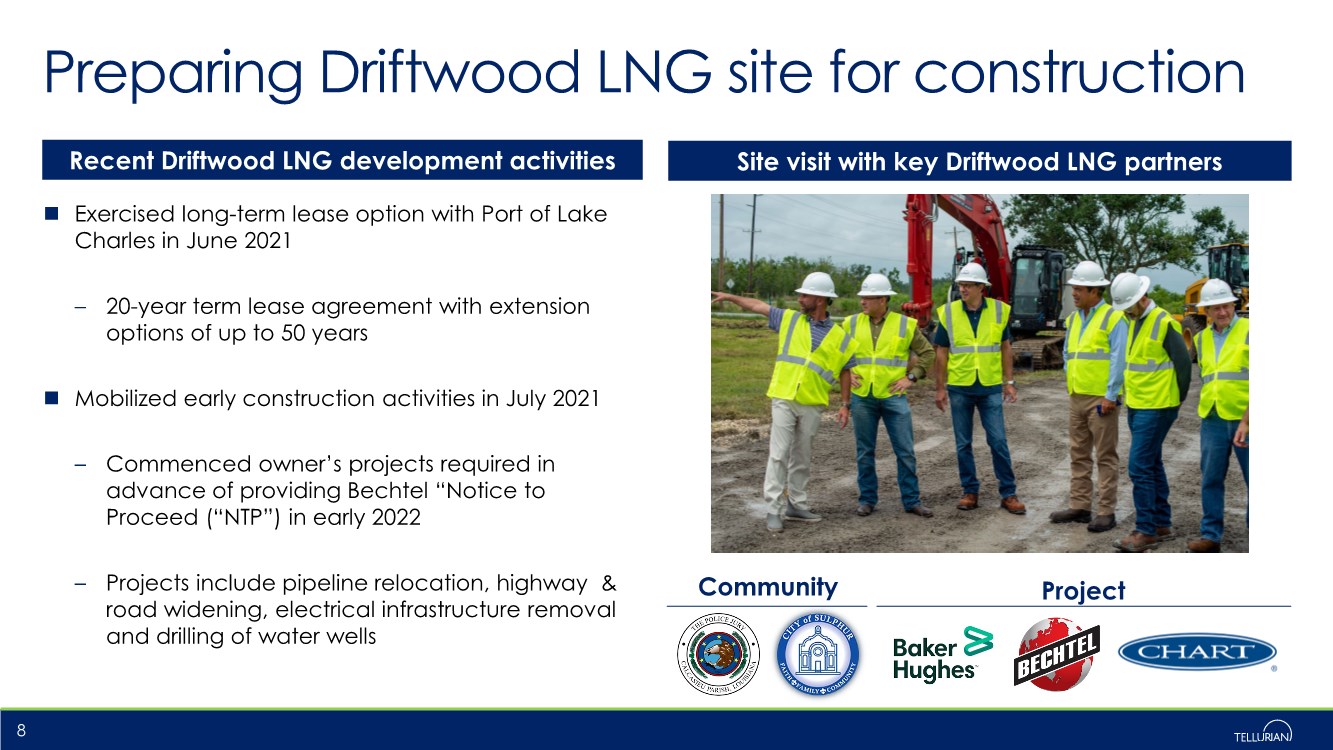
| Preparing Driftwood LNG site for construction Exercised long-term lease option with Port of Lake Charles in June 2021 – 20-year term lease agreement with extension options of up to 50 years Mobilized early construction activities in July 2021 – Commenced owner’s projects required in advance of providing Bechtel “Notice to Proceed (“NTP”) in early 2022 – Projects include pipeline relocation, highway & road widening, electrical infrastructure removal and drilling of water wells 8 Site visit with key Driftwood LNG partners Community Project Recent Driftwood LNG development activities |
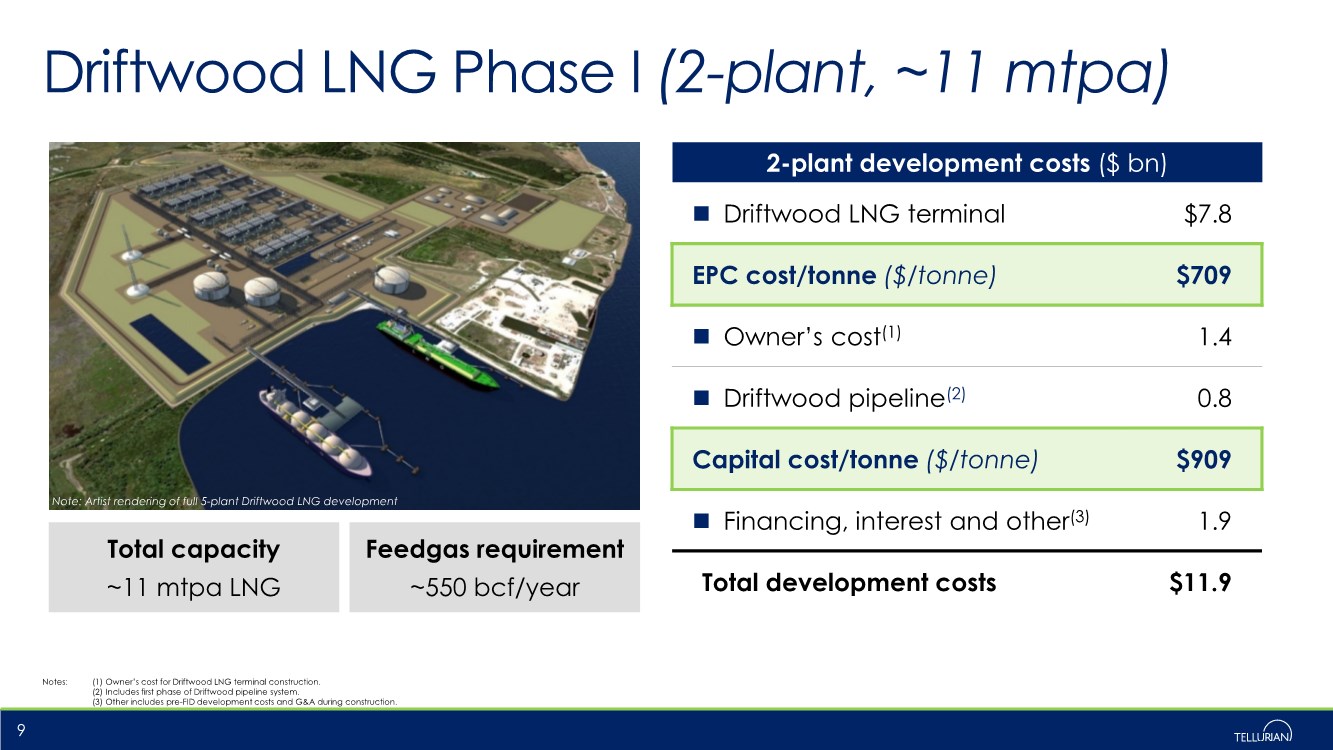
| Driftwood LNG Phase I (2-plant, ~11 mtpa) Notes: (1) Owner’s cost for Driftwood LNG terminal construction. (2) Includes first phase of Driftwood pipeline system. (3) Other includes pre-FID development costs and G&A during construction. 9 2-plant development costs ($ bn) Driftwood LNG terminal $7.8 EPC cost/tonne ($/tonne) $709 Owner’s cost(1) 1.4 Driftwood pipeline(2) 0.8 Capital cost/tonne ($/tonne) $909 Financing, interest and other(3) 1.9 Total development costs $11.9 Total capacity ~11 mtpa LNG Feedgas requirement ~550 bcf/year Note: Artist rendering of full 5-plant Driftwood LNG development |
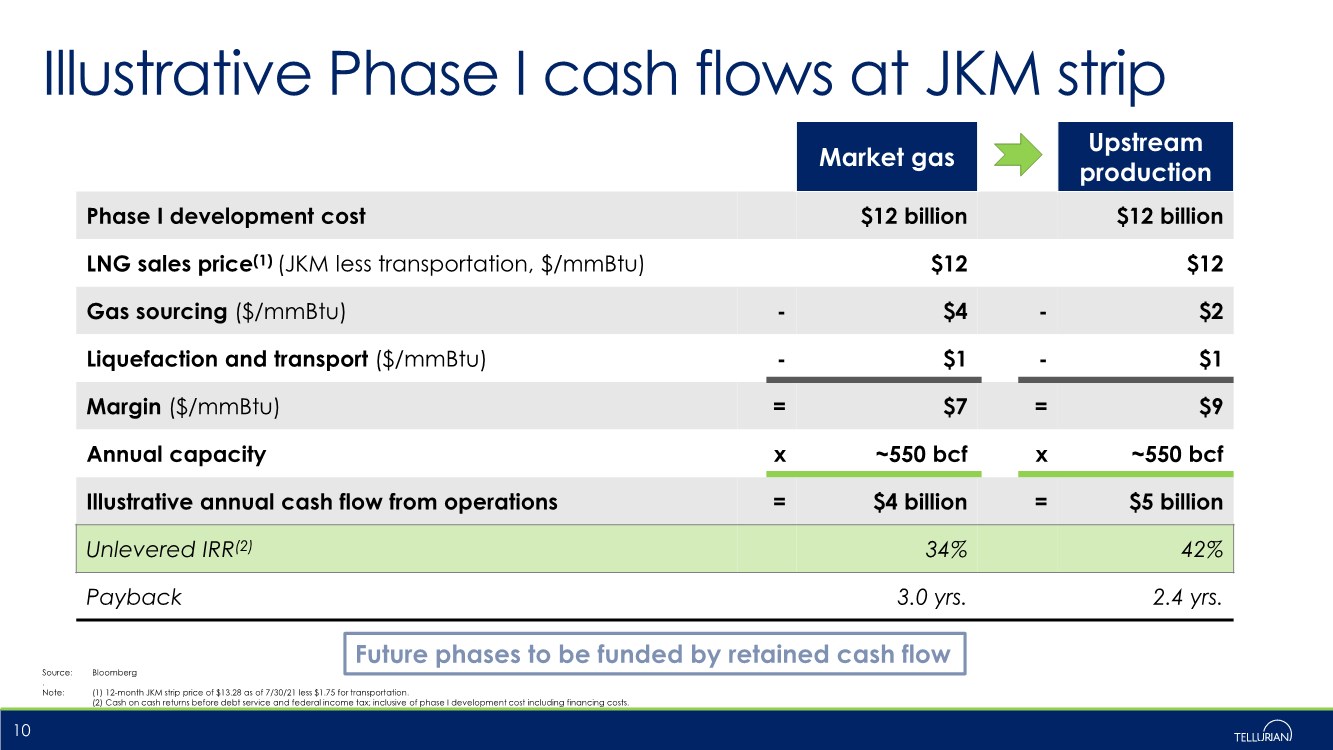
| Illustrative Phase I cash flows at JKM strip Source: Bloomberg .. Note: (1) 12-month JKM strip price of $13.28 as of 7/30/21 less $1.75 for transportation. (2) Cash on cash returns before debt service and federal income tax; inclusive of phase I development cost including financing costs. 10 Market gas Upstream production Phase I development cost $12 billion $12 billion LNG sales price(1) (JKM less transportation, $/mmBtu) $12 $12 Gas sourcing ($/mmBtu) - $4 - $2 Liquefaction and transport ($/mmBtu) - $1 - $1 Margin ($/mmBtu) = $7 = $9 Annual capacity x ~550 bcf x ~550 bcf Illustrative annual cash flow from operations = $4 billion = $5 billion Unlevered IRR(2) 34% 42% Payback 3.0 yrs. 2.4 yrs. Future phases to be funded by retained cash flow |
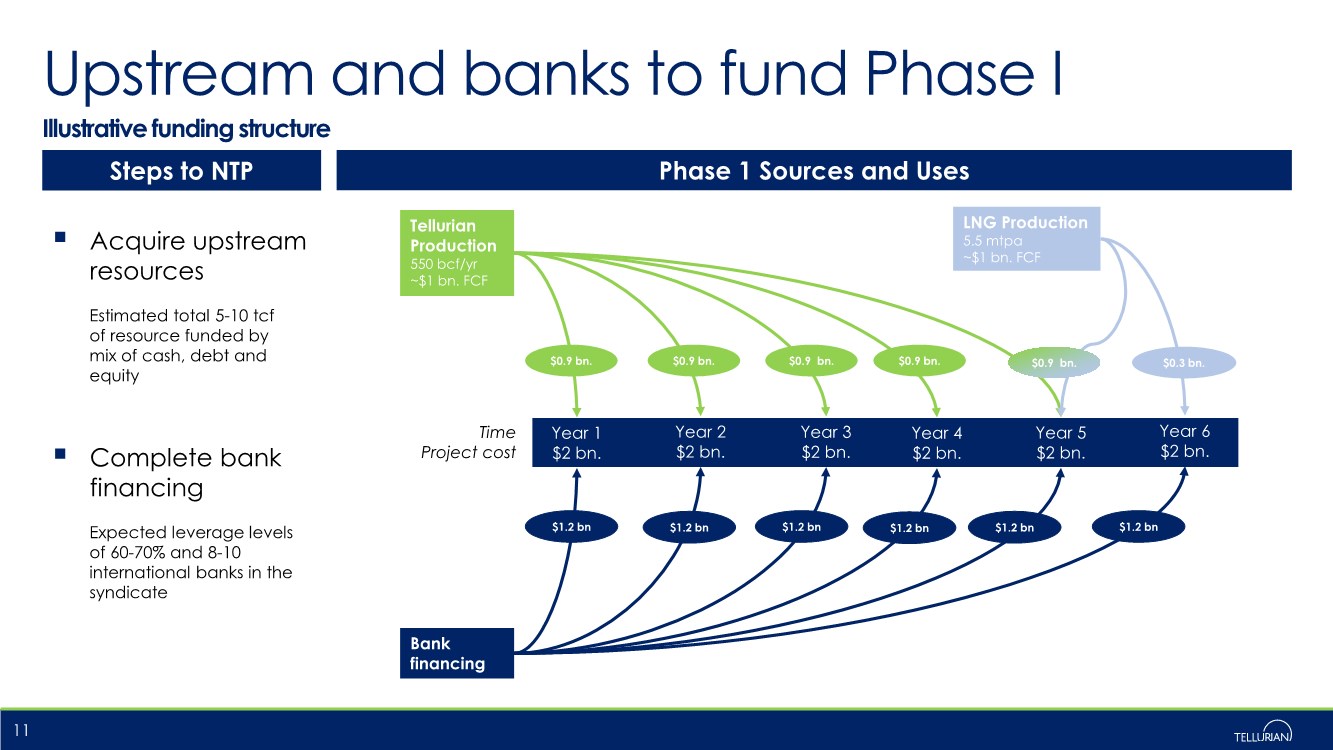
| Upstream and banks to fund Phase I Illustrative funding structure 11 Steps to NTP .. Acquire upstream resources Estimated total 5-10 tcf of resource funded by mix of cash, debt and equity Phase 1 Sources and Uses Bank financing Year 1 $2 bn. Year 2 $2 bn. Year 3 $2 bn. $0.9 bn. $1.2 bn $1.2 bn Tellurian Production 550 bcf/yr ~$1 bn. FCF $1.2 bn Time Project cost Year 4 $2 bn. Year 5 $2 bn. Year 6 $2 bn. $1.2 bn $1.2 bn $1.2 bn $0.9 bn. $0.9 bn. $0.9 bn. LNG Production 5.5 mtpa ~$1 bn. FCF $0.9 bn. $0.3 bn. .. Complete bank financing Expected leverage levels of 60-70% and 8-10 international banks in the syndicate |
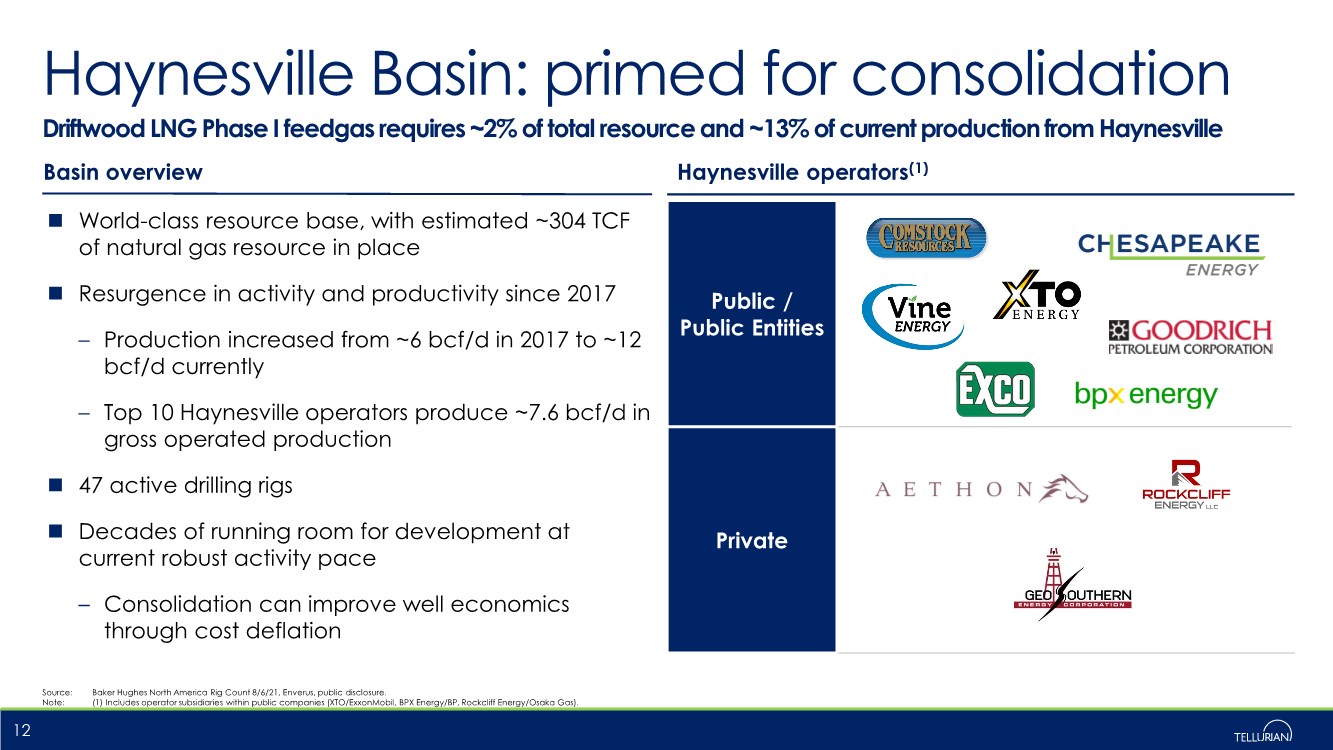
| Driftwood LNG Phase I feedgas requires ~2% of total resource and ~13% of current production from Haynesville Public / Public Entities Private World-class resource base, with estimated ~304 TCF of natural gas resource in place Resurgence in activity and productivity since 2017 – Production increased from ~6 bcf/d in 2017 to ~12 bcf/d currently – Top 10 Haynesville operators produce ~7.6 bcf/d in gross operated production 47 active drilling rigs Decades of running room for development at current robust activity pace – Consolidation can improve well economics through cost deflation Haynesville Basin: primed for consolidation 12 Basin overview Haynesville operators(1) Source: Baker Hughes North America Rig Count 8/6/21, Enverus, public disclosure. Note: (1) Includes operator subsidiaries within public companies (XTO/ExxonMobil, BPX Energy/BP, Rockcliff Energy/Osaka Gas). |
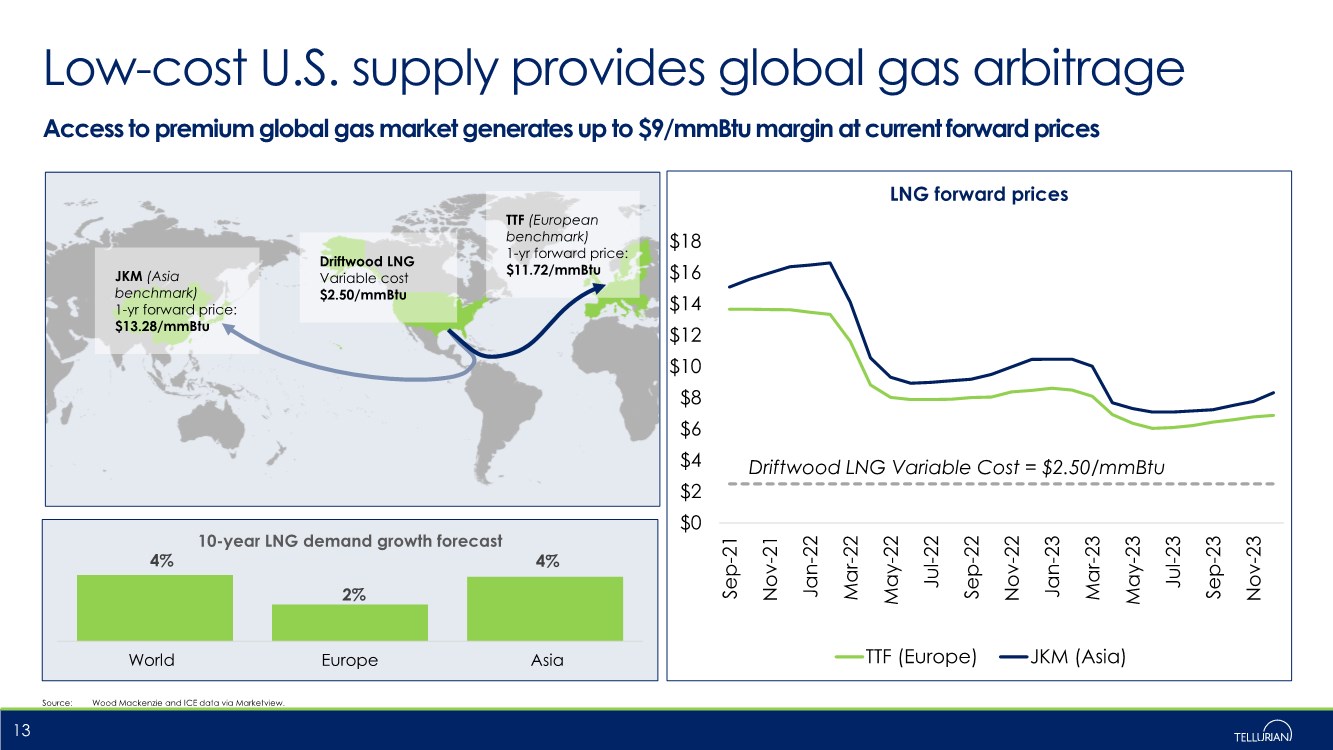
| Low-cost U.S. supply provides global gas arbitrage 13 Access to premium global gas market generates up to $9/mmBtu margin at current forward prices 4% 2% 4% 10-year LNG demand growth forecast JKM (Asia benchmark) 1-yr forward price: $13.28/mmBtu TTF (European benchmark) 1-yr forward price: $11.72/mmBtu Driftwood LNG Variable cost $2.50/mmBtu Source: Wood Mackenzie and ICE data via Marketview. Driftwood LNG Variable Cost = $2.50/mmBtu $0 $2 $4 $6 $8 $10 $12 $14 $16 $18 Sep-21 Nov-21 Jan-22 Mar-22 May-22 Jul-22 Sep-22 Nov-22 Jan-23 Mar-23 May-23 Jul-23 Sep-23 Nov-23 LNG forward prices TTF (Europe) JKM (Asia) World Europe Asia |
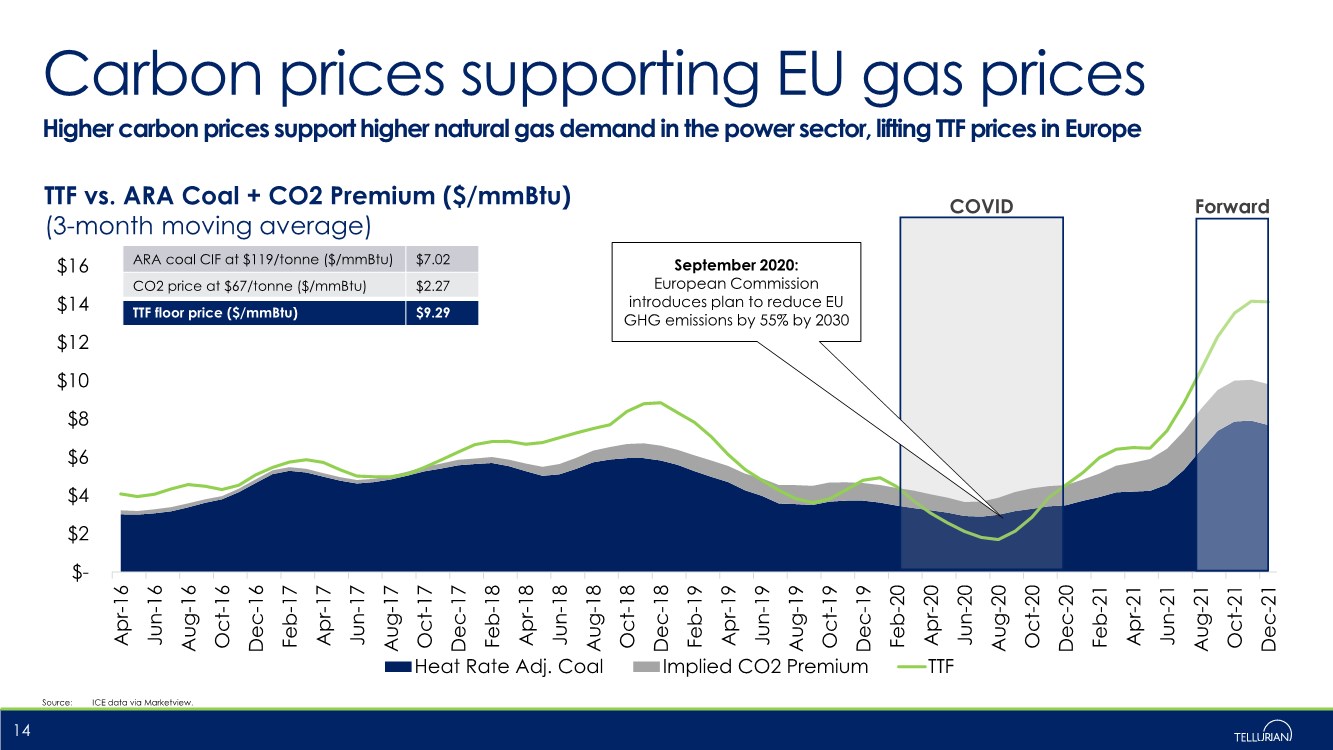
| $- $2 $4 $6 $8 $10 $12 $14 $16 Apr-16 Jun-16 Aug-16 Oct-16 Dec-16 Feb-17 Apr-17 Jun-17 Aug-17 Oct-17 Dec-17 Feb-18 Apr-18 Jun-18 Aug-18 Oct-18 Dec-18 Feb-19 Apr-19 Jun-19 Aug-19 Oct-19 Dec-19 Feb-20 Apr-20 Jun-20 Aug-20 Oct-20 Dec-20 Feb-21 Apr-21 Jun-21 Aug-21 Oct-21 Dec-21 Heat Rate Adj. Coal Implied CO2 Premium TTF Carbon prices supporting EU gas prices Higher carbon prices support higher natural gas demand in the power sector, lifting TTF prices in Europe Source: ICE data via Marketview. 14 COVID Forward September 2020: European Commission introduces plan to reduce EU GHG emissions by 55% by 2030 TTF vs. ARA Coal + CO2 Premium ($/mmBtu) (3-month moving average) ARA coal CIF at $119/tonne ($/mmBtu) $7.02 CO2 price at $67/tonne ($/mmBtu) $2.27 TTF floor price ($/mmBtu) $9.29 |
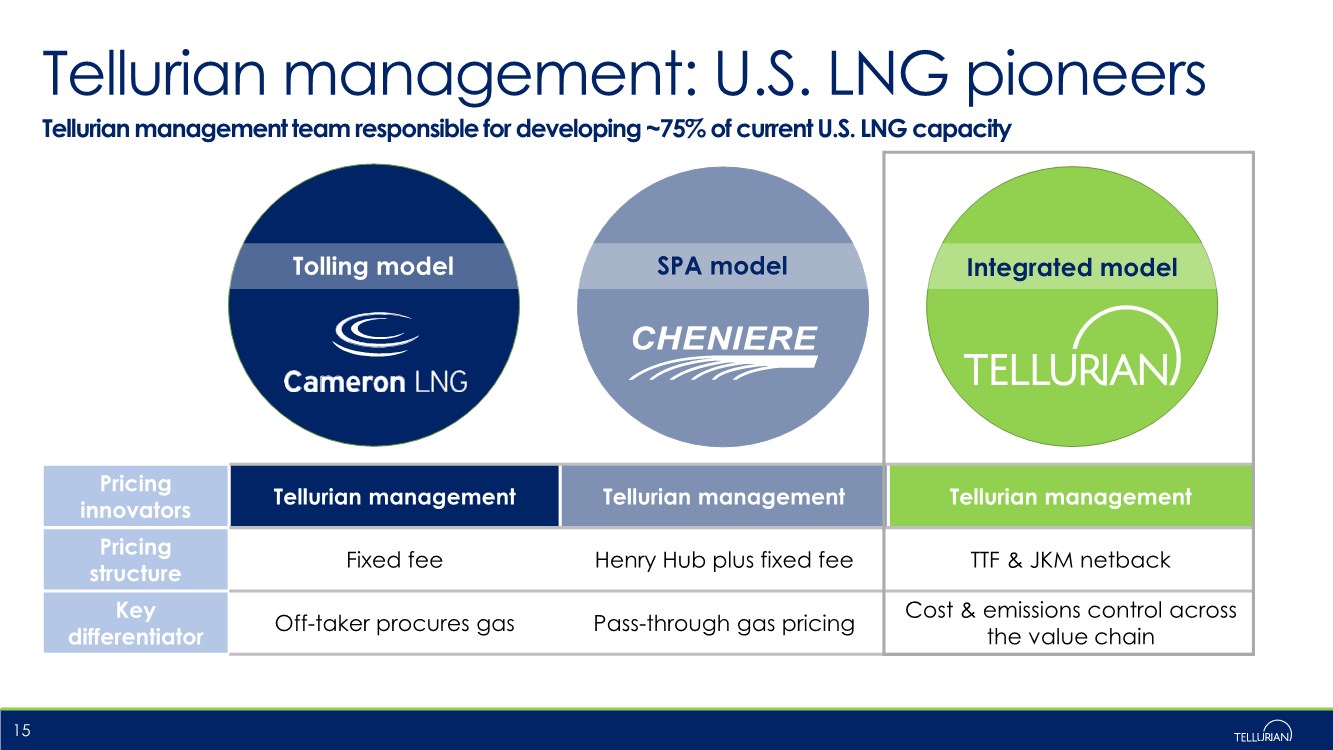
| Tellurian management: U.S. LNG pioneers 15 Tellurian management team responsible for developing ~75% of current U.S. LNG capacity Tolling model SPA model Integrated model Pricing innovators Tellurian management Tellurian management Tellurian management Pricing structure Fixed fee Henry Hub plus fixed fee TTF & JKM netback Key differentiator Off-taker procures gas Pass-through gas pricing Cost & emissions control across the value chain |
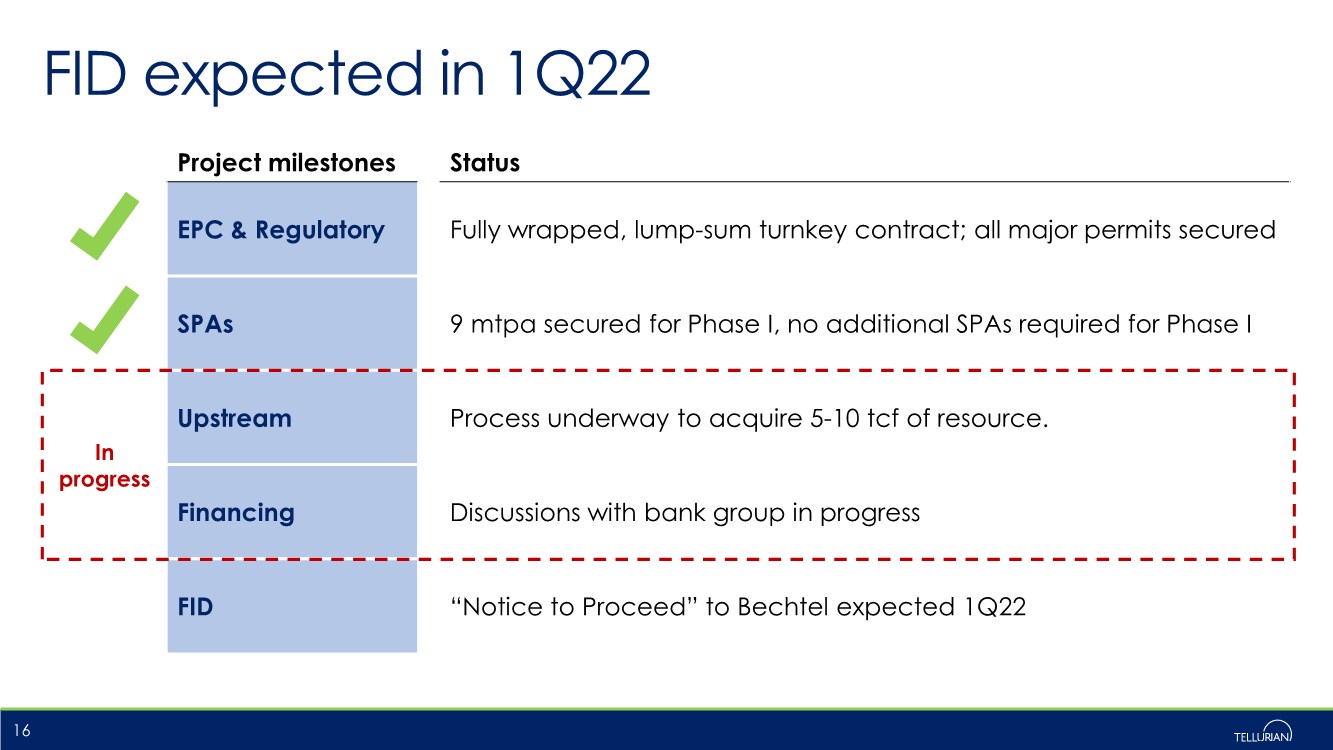
| FID expected in 1Q22 16 Project milestones Status EPC & Regulatory Fully wrapped, lump-sum turnkey contract; all major permits secured SPAs 9 mtpa secured for Phase I, no additional SPAs required for Phase I Upstream Process underway to acquire 5-10 tcf of resource. Financing Discussions with bank group in progress FID “Notice to Proceed” to Bechtel expected 1Q22 In progress |
| Contact us .. Matt Phillips VP, Investor Relations & Finance +1 832 320 9331 matthew.phillips@tellurianinc.com .. Joi Lecznar EVP, Public & Government Affairs +1 832 962 4044 joi.lecznar@tellurianinc.com 17 .. Johan Yokay Director, Investor Relations & Finance +1 832 320 9327 johan.yokay@tellurianinc.com |
| Low-cost U.S. natural gas critical in supplying global LNG demand growth |
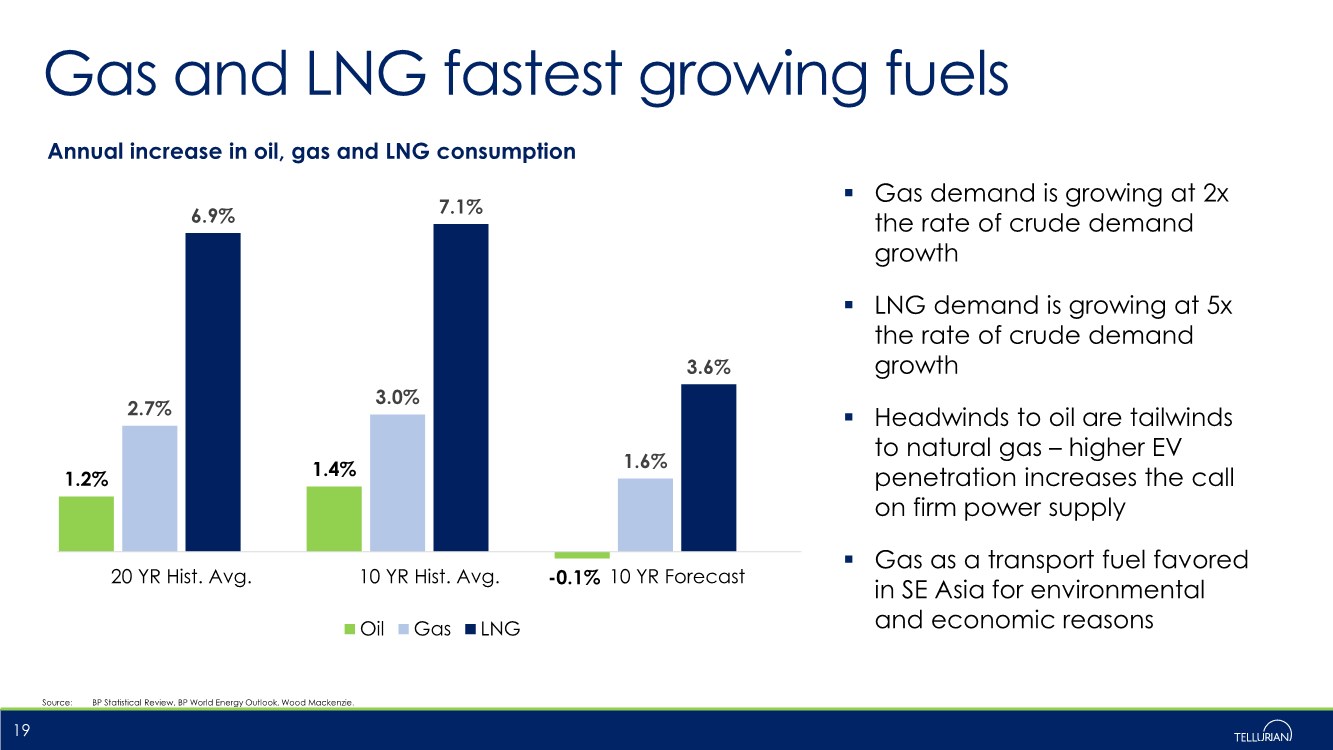
| Gas and LNG fastest growing fuels 1.2% 1.4% -0.1% 2.7% 3.0% 1.6% 6.9% 7.1% 3.6% 20 YR Hist. Avg. 10 YR Hist. Avg. 10 YR Forecast Annual increase in oil, gas and LNG consumption Oil Gas LNG .. Gas demand is growing at 2x the rate of crude demand growth .. LNG demand is growing at 5x the rate of crude demand growth .. Headwinds to oil are tailwinds to natural gas – higher EV penetration increases the call on firm power supply .. Gas as a transport fuel favored in SE Asia for environmental and economic reasons Source: BP Statistical Review, BP World Energy Outlook, Wood Mackenzie. 19 |
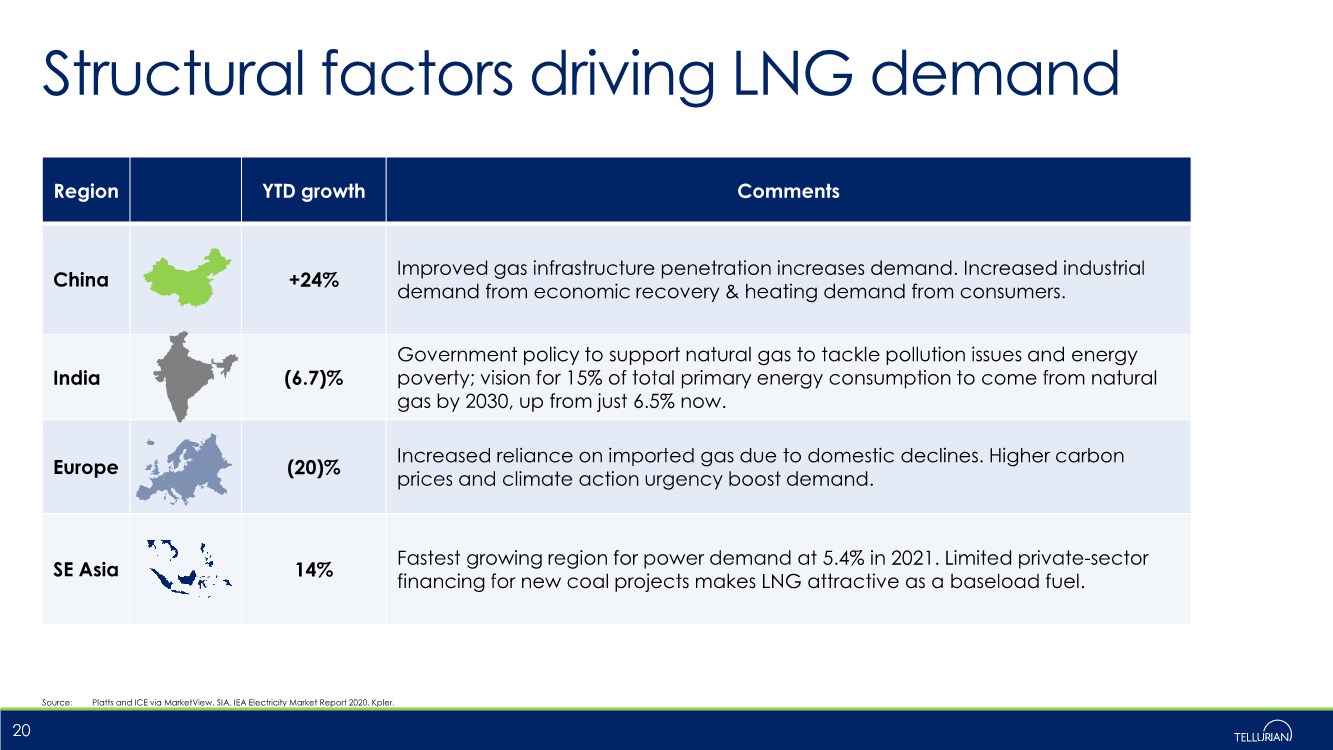
| Structural factors driving LNG demand Source: Platts and ICE via MarketView, SIA, IEA Electricity Market Report 2020, Kpler. 20 Region YTD growth Comments China +24% Improved gas infrastructure penetration increases demand. Increased industrial demand from economic recovery & heating demand from consumers. India (6.7)% Government policy to support natural gas to tackle pollution issues and energy poverty; vision for 15% of total primary energy consumption to come from natural gas by 2030, up from just 6.5% now. Europe (20)% Increased reliance on imported gas due to domestic declines. Higher carbon prices and climate action urgency boost demand. SE Asia 14% Fastest growing region for power demand at 5.4% in 2021. Limited private-sector financing for new coal projects makes LNG attractive as a baseload fuel. |
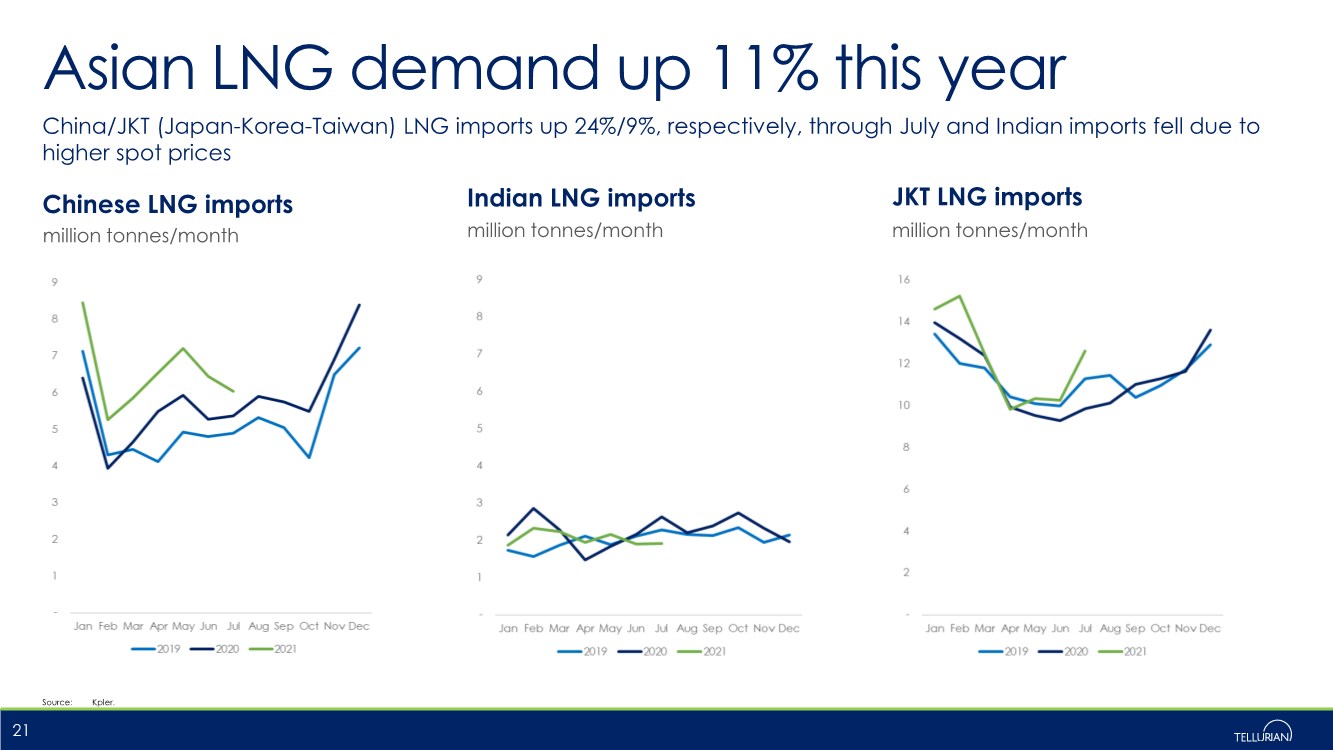
| Asian LNG demand up 11% this year China/JKT (Japan-Korea-Taiwan) LNG imports up 24%/9%, respectively, through July and Indian imports fell due to higher spot prices 21 Source: Kpler. Chinese LNG imports Indian LNG imports million tonnes/month million tonnes/month JKT LNG imports million tonnes/month |
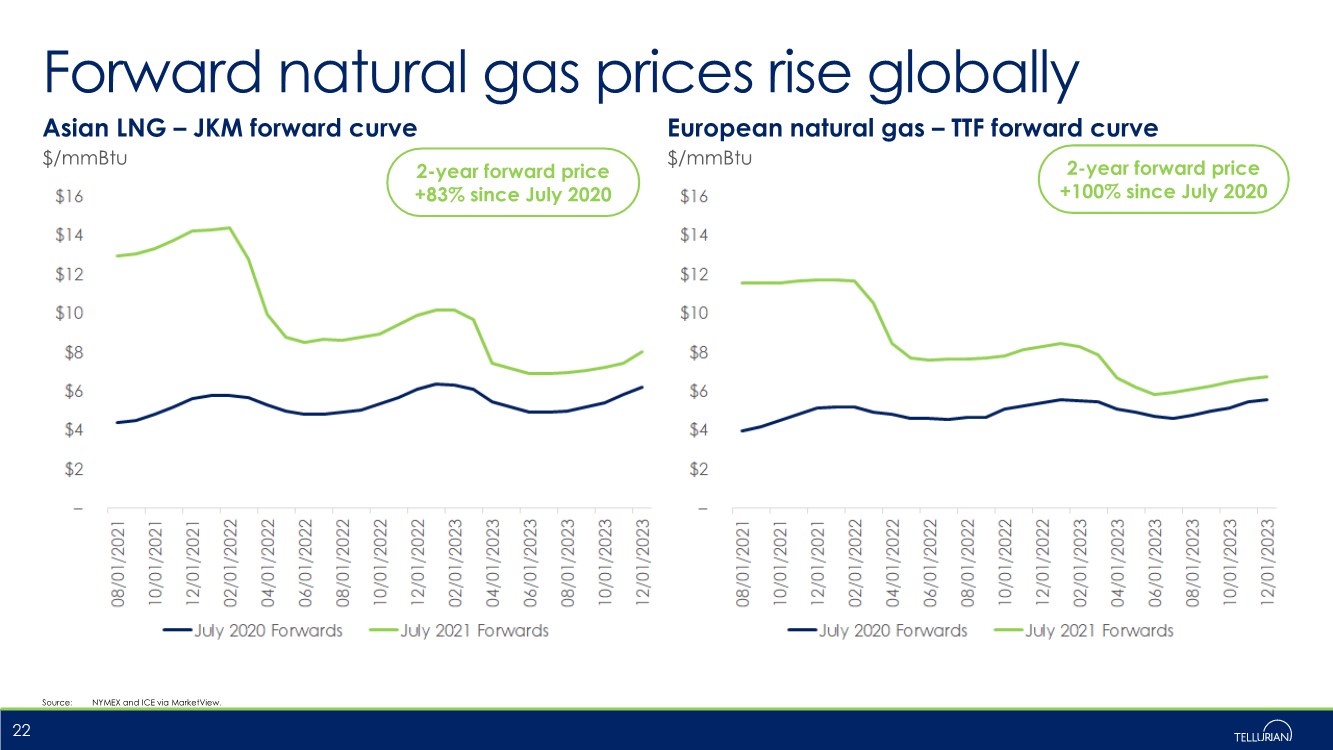
| Forward natural gas prices rise globally Asian LNG – JKM forward curve European natural gas – TTF forward curve 22 $/mmBtu $/mmBtu Source: NYMEX and ICE via MarketView. 2-year forward price +83% since July 2020 2-year forward price +100% since July 2020 |
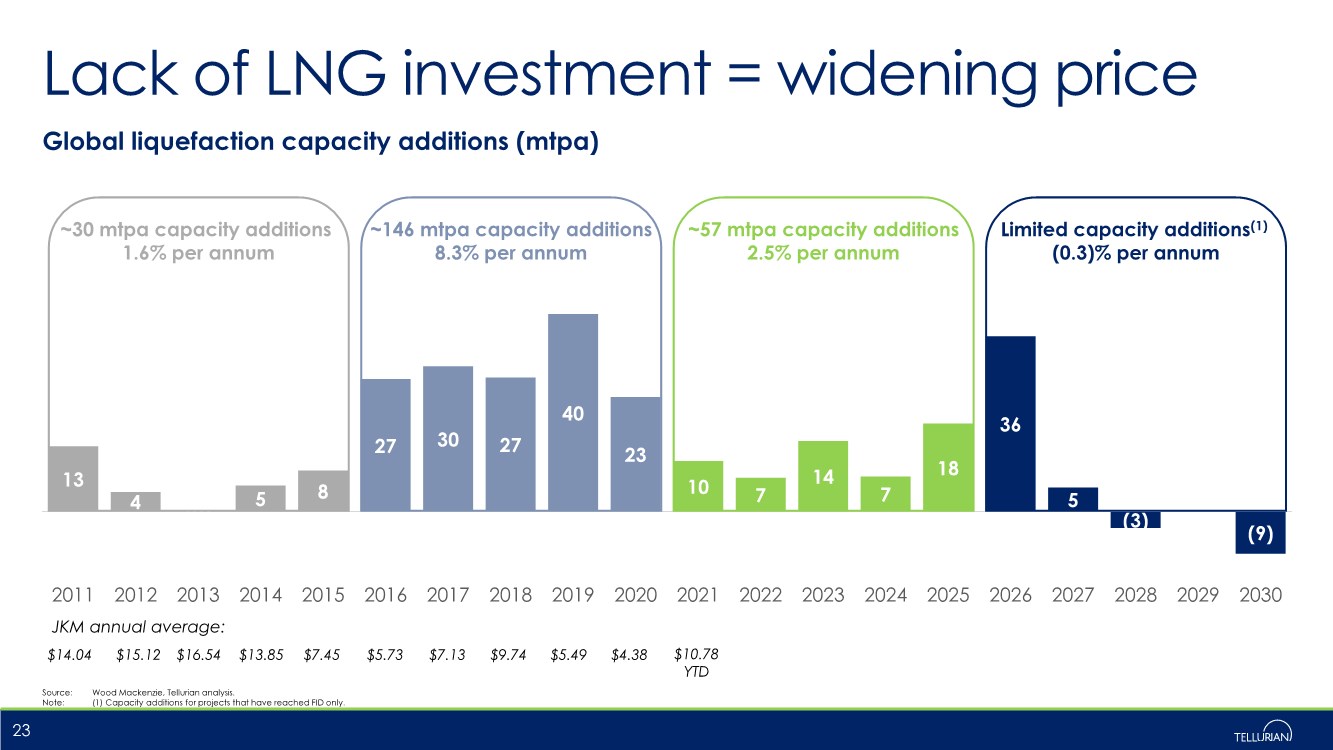
| Lack of LNG investment = widening price Source: Wood Mackenzie, Tellurian analysis. Note: (1) Capacity additions for projects that have reached FID only. 23 13 4 (0) 5 8 27 30 27 40 23 10 7 14 7 18 36 5 (3) -- (9) 2011 2012 2013 2014 2015 2016 2017 2018 2019 2020 2021 2022 2023 2024 2025 2026 2027 2028 2029 2030 ~146 mtpa capacity additions 8.3% per annum Limited capacity additions(1) (0.3)% per annum Global liquefaction capacity additions (mtpa) ~57 mtpa capacity additions 2.5% per annum ~30 mtpa capacity additions 1.6% per annum $14.04 $15.12 $16.54 $13.85 $7.45 $5.73 $7.13 $9.74 $5.49 JKM annual average: $4.38 $10.78 YTD |
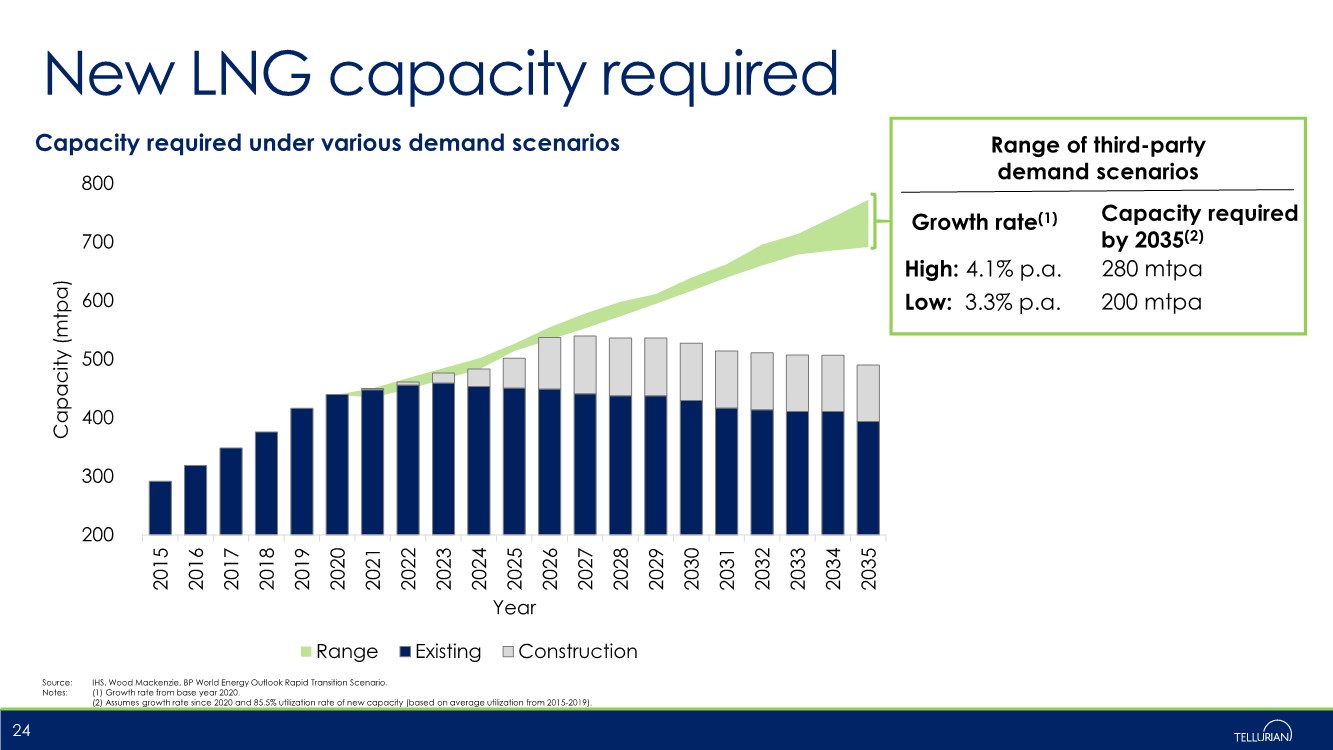
| New LNG capacity required Source: IHS, Wood Mackenzie, BP World Energy Outlook Rapid Transition Scenario. Notes: (1) Growth rate from base year 2020. (2) Assumes growth rate since 2020 and 85.5% utilization rate of new capacity (based on average utilization from 2015-2019). 24 Range of third-party demand scenarios High: 4.1% p.a. Low: 3.3% p.a. 280 mtpa 200 mtpa Growth rate(1) Capacity required by 2035(2) 200 300 400 500 600 700 800 2015 2016 2017 2018 2019 2020 2021 2022 2023 2024 2025 2026 2027 2028 2029 2030 2031 2032 2033 2034 2035 Capacity (mtpa) Year Capacity required under various demand scenarios Range Existing Construction |
| LNG critical to global decarbonization |
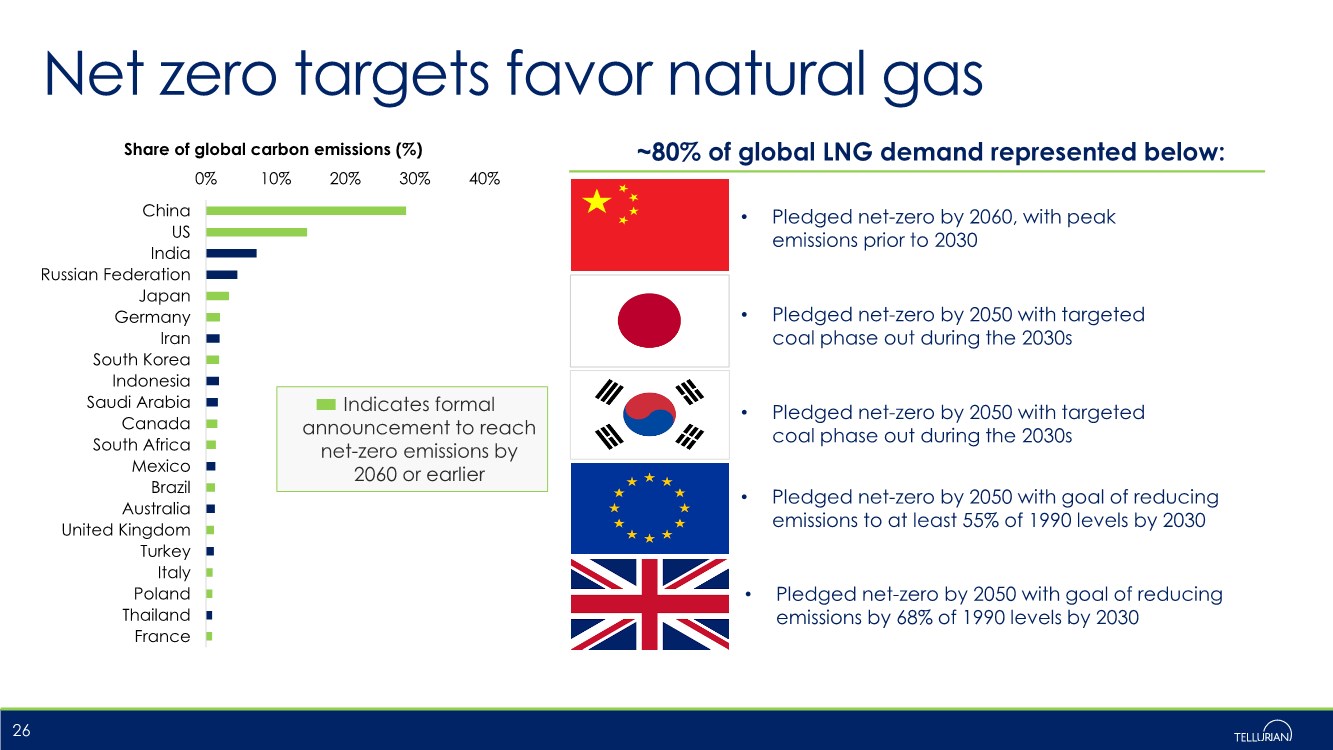
| Indicates formal announcement to reach net-zero emissions by 2060 or earlier Net zero targets favor natural gas 26 ~80% of global LNG demand represented below: • Pledged net-zero by 2060, with peak emissions prior to 2030 • Pledged net-zero by 2050 with targeted coal phase out during the 2030s • Pledged net-zero by 2050 with goal of reducing emissions to at least 55% of 1990 levels by 2030 • Pledged net-zero by 2050 with targeted coal phase out during the 2030s • Pledged net-zero by 2050 with goal of reducing emissions by 68% of 1990 levels by 2030 0% 10% 20% 30% 40% China US India Russian Federation Japan Germany Iran South Korea Indonesia Saudi Arabia Canada South Africa Mexico Brazil Australia United Kingdom Turkey Italy Poland Thailand France Share of global carbon emissions (%) |
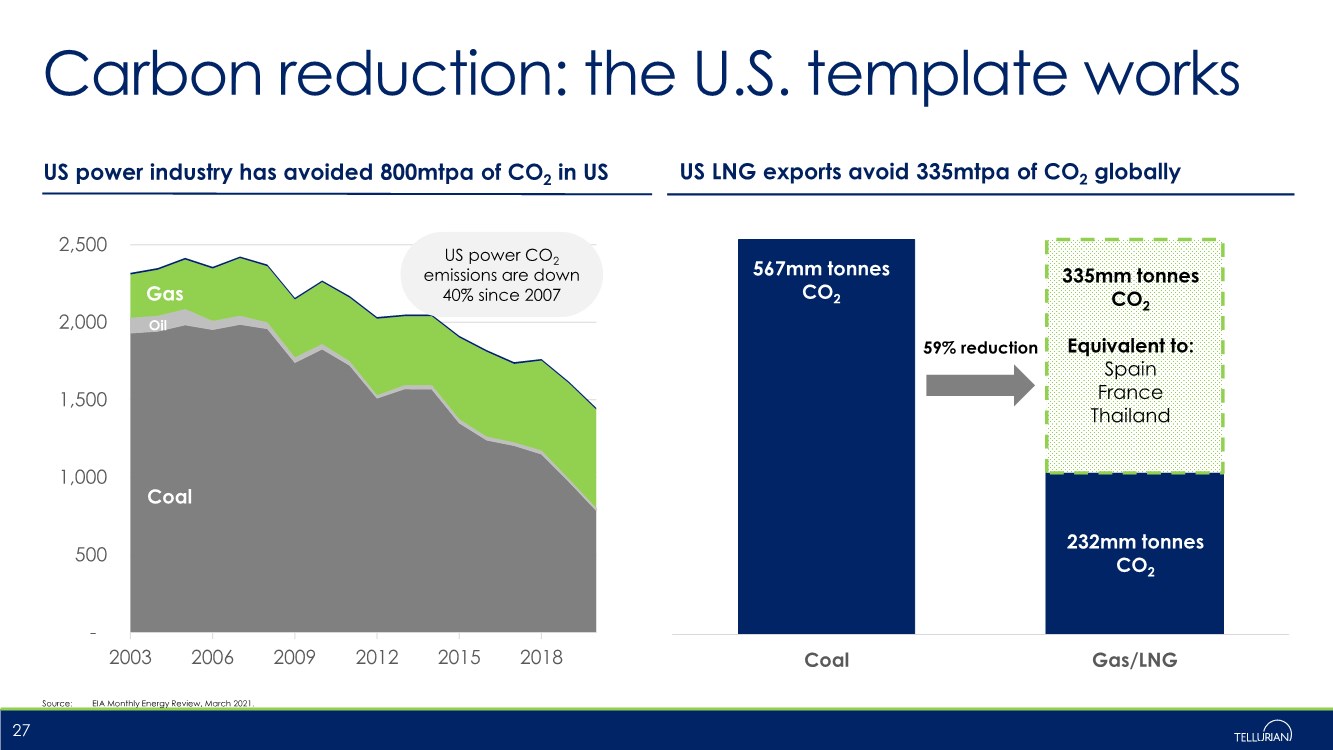
| Carbon reduction: the U.S. template works 27 US power industry has avoided 800mtpa of CO2 in US Source: EIA Monthly Energy Review, March 2021. Coal Gas/LNG 567mm tonnes CO2 335mm tonnes CO2 Equivalent to: Spain France Thailand 232mm tonnes CO2 59% reduction US LNG exports avoid 335mtpa of CO2 globally - 500 1,000 1,500 2,000 2,500 2003 2006 2009 2012 2015 2018 Coal Gas Oil US power CO2 emissions are down 40% since 2007 |
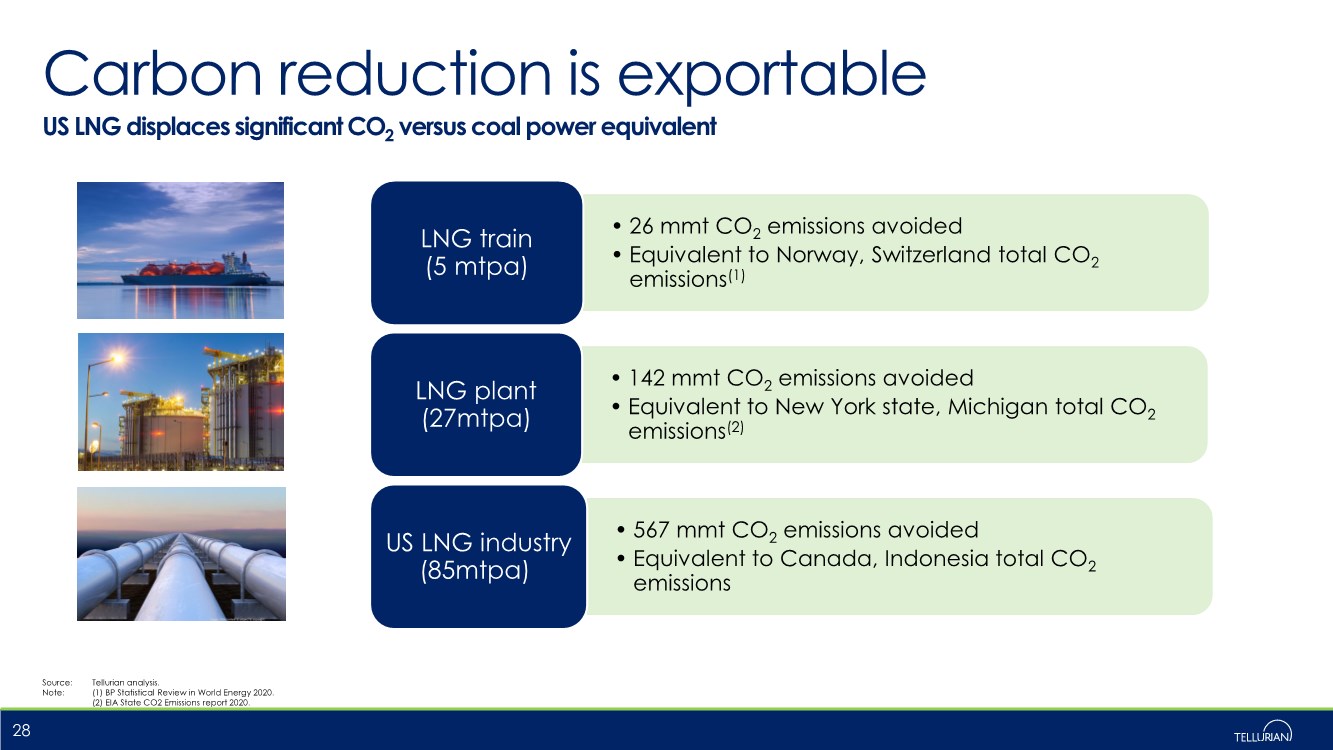
| Carbon reduction is exportable Source: Tellurian analysis. Note: (1) BP Statistical Review in World Energy 2020. (2) EIA State CO2 Emissions report 2020. 28 US LNG displaces significant CO2 versus coal power equivalent • 26 mmt CO2 emissions avoided • Equivalent to Norway, Switzerland total CO2 emissions(1) LNG train (5 mtpa) • 142 mmt CO2 emissions avoided • Equivalent to New York state, Michigan total CO2 emissions(2) LNG plant (27mtpa) • 567 mmt CO2 emissions avoided • Equivalent to Canada, Indonesia total CO2 emissions US LNG industry (85mtpa) |
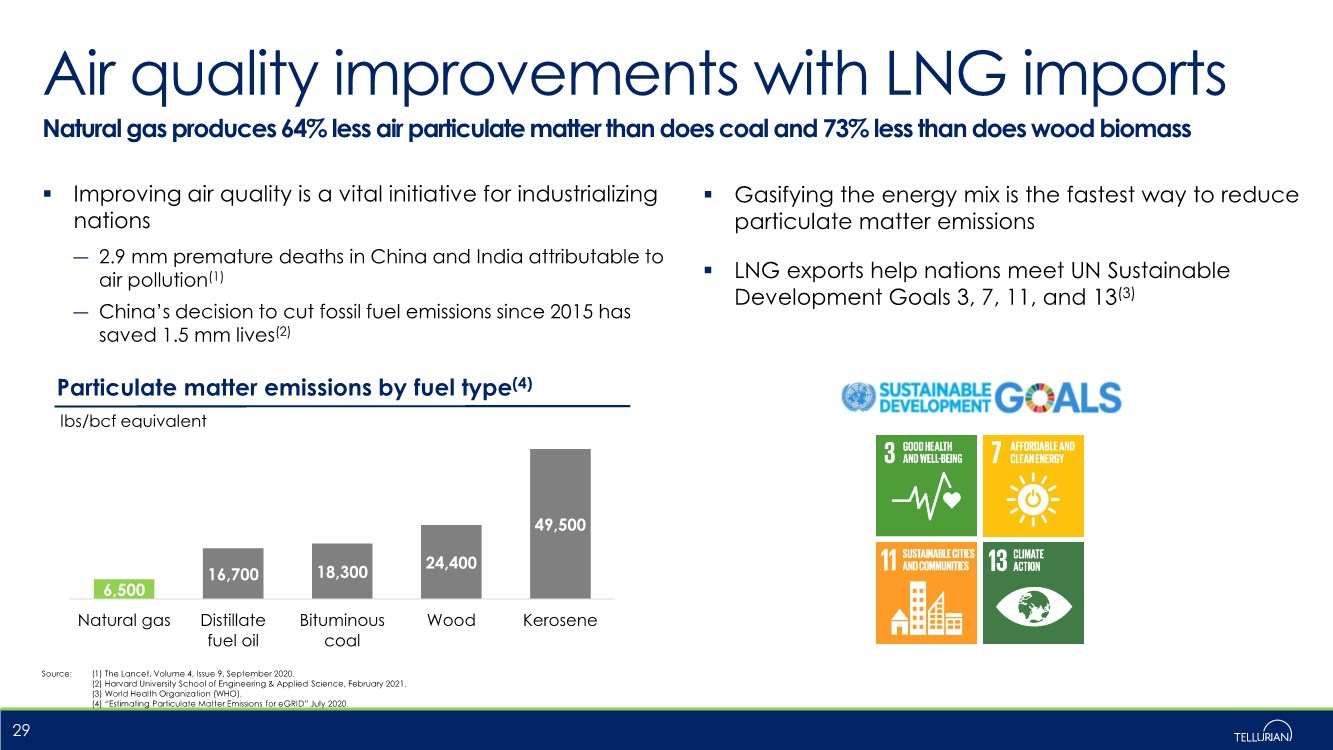
| Air quality improvements with LNG imports Natural gas produces 64% less air particulate matter than does coal and 73% less than does wood biomass .. Improving air quality is a vital initiative for industrializing nations ― 2.9 mm premature deaths in China and India attributable to air pollution(1) ― China’s decision to cut fossil fuel emissions since 2015 has saved 1.5 mm lives(2) Source: (1) The Lancet, Volume 4, Issue 9, September 2020. (2) Harvard University School of Engineering & Applied Science, February 2021. (3) World Health Organization (WHO). (4) “Estimating Particulate Matter Emissions for eGRID” July 2020. 29 Particulate matter emissions by fuel type(4) 6,500 16,700 18,300 24,400 49,500 Natural gas Distillate fuel oil Bituminous coal Wood Kerosene lbs/bcf equivalent .. Gasifying the energy mix is the fastest way to reduce particulate matter emissions .. LNG exports help nations meet UN Sustainable Development Goals 3, 7, 11, and 13(3) |
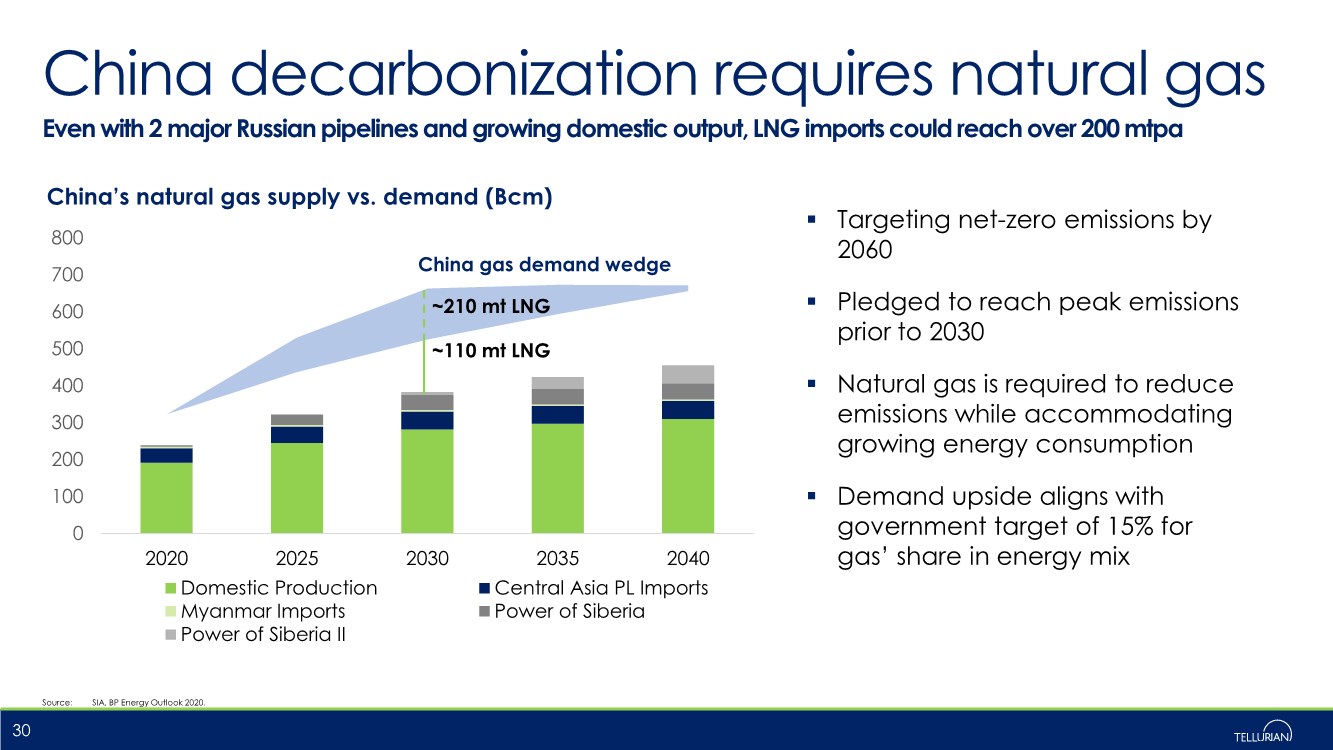
| China decarbonization requires natural gas Even with 2 major Russian pipelines and growing domestic output, LNG imports could reach over 200 mtpa .. Targeting net-zero emissions by 2060 .. Pledged to reach peak emissions prior to 2030 .. Natural gas is required to reduce emissions while accommodating growing energy consumption .. Demand upside aligns with government target of 15% for gas’ share in energy mix Source: SIA, BP Energy Outlook 2020. 30 0 100 200 300 400 500 600 700 800 2020 2025 2030 2035 2040 China’s natural gas supply vs. demand (Bcm) Domestic Production Central Asia PL Imports Myanmar Imports Power of Siberia Power of Siberia II China gas demand wedge ~210 mt LNG ~110 mt LNG |
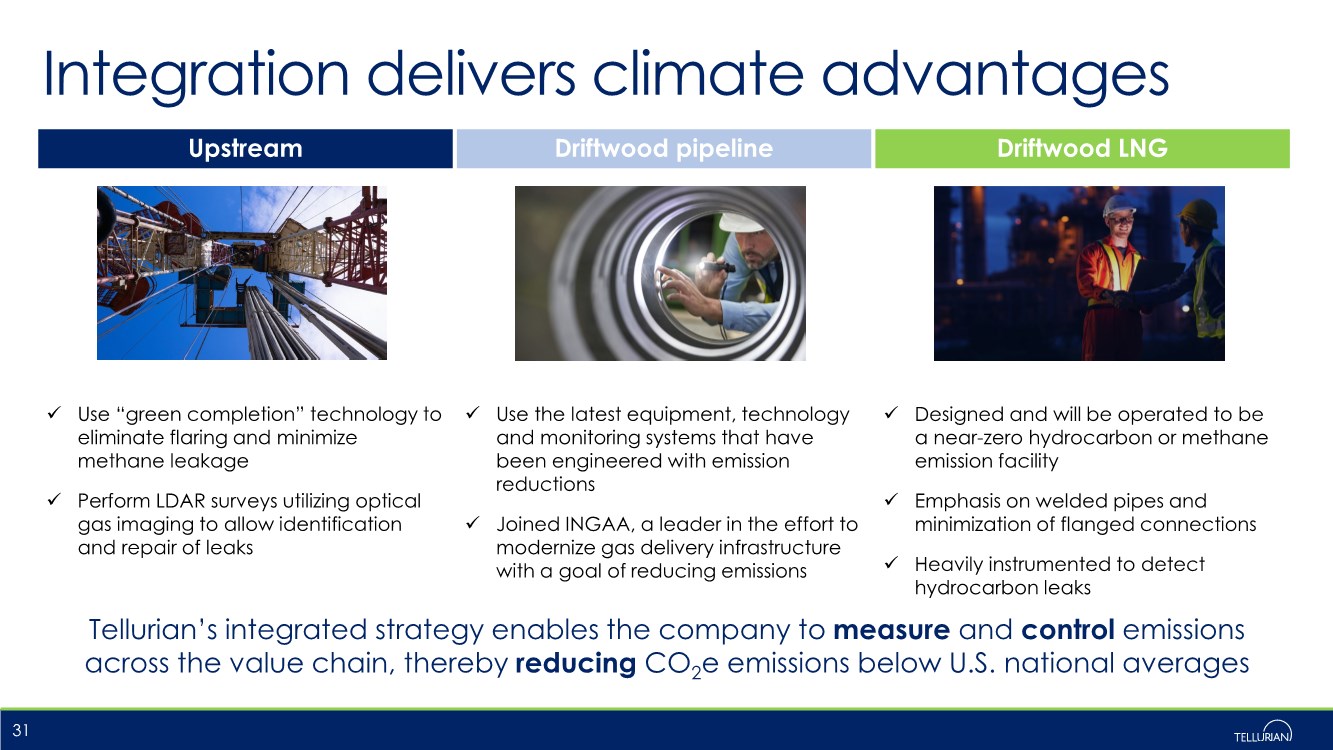
| Upstream Driftwood pipeline Driftwood LNG Use “green completion” technology to eliminate flaring and minimize methane leakage Perform LDAR surveys utilizing optical gas imaging to allow identification and repair of leaks Use the latest equipment, technology and monitoring systems that have been engineered with emission reductions Joined INGAA, a leader in the effort to modernize gas delivery infrastructure with a goal of reducing emissions Designed and will be operated to be a near-zero hydrocarbon or methane emission facility Emphasis on welded pipes and minimization of flanged connections Heavily instrumented to detect hydrocarbon leaks Integration delivers climate advantages 31 Tellurian’s integrated strategy enables the company to measure and control emissions across the value chain, thereby reducing CO2e emissions below U.S. national averages |
| Appendix: Driftwood LNG details |
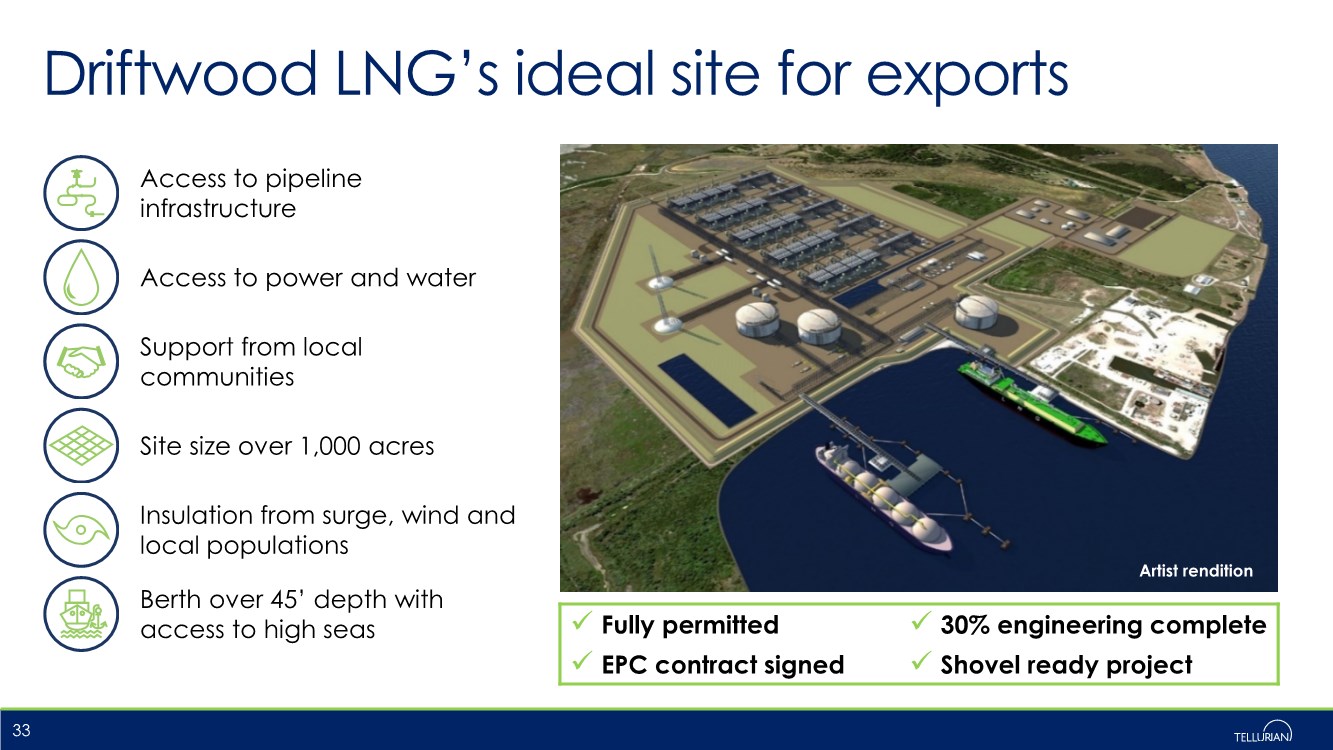
| Driftwood LNG’s ideal site for exports 33 Access to power and water Berth over 45’ depth with access to high seas Support from local communities Access to pipeline infrastructure Site size over 1,000 acres Insulation from surge, wind and local populations Artist rendition Fully permitted 30% engineering complete EPC contract signed Shovel ready project |
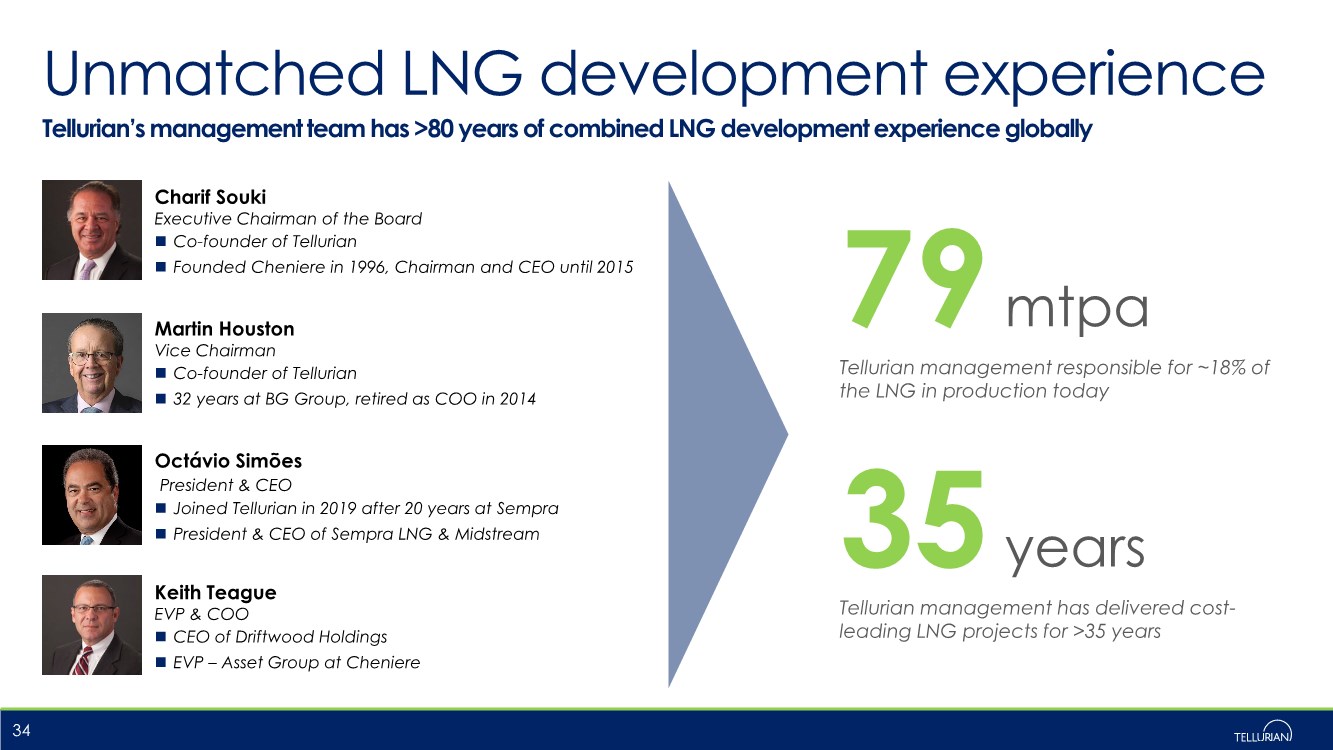
| Unmatched LNG development experience Tellurian’s management team has >80 years of combined LNG development experience globally 34 Charif Souki Executive Chairman of the Board Co-founder of Tellurian Founded Cheniere in 1996, Chairman and CEO until 2015 Martin Houston Vice Chairman Co-founder of Tellurian 32 years at BG Group, retired as COO in 2014 Octávio Simões President & CEO Joined Tellurian in 2019 after 20 years at Sempra President & CEO of Sempra LNG & Midstream 79 mtpa Tellurian management responsible for ~18% of the LNG in production today 35 years Tellurian management has delivered cost- leading LNG projects for >35 years Keith Teague EVP & COO CEO of Driftwood Holdings EVP – Asset Group at Cheniere |
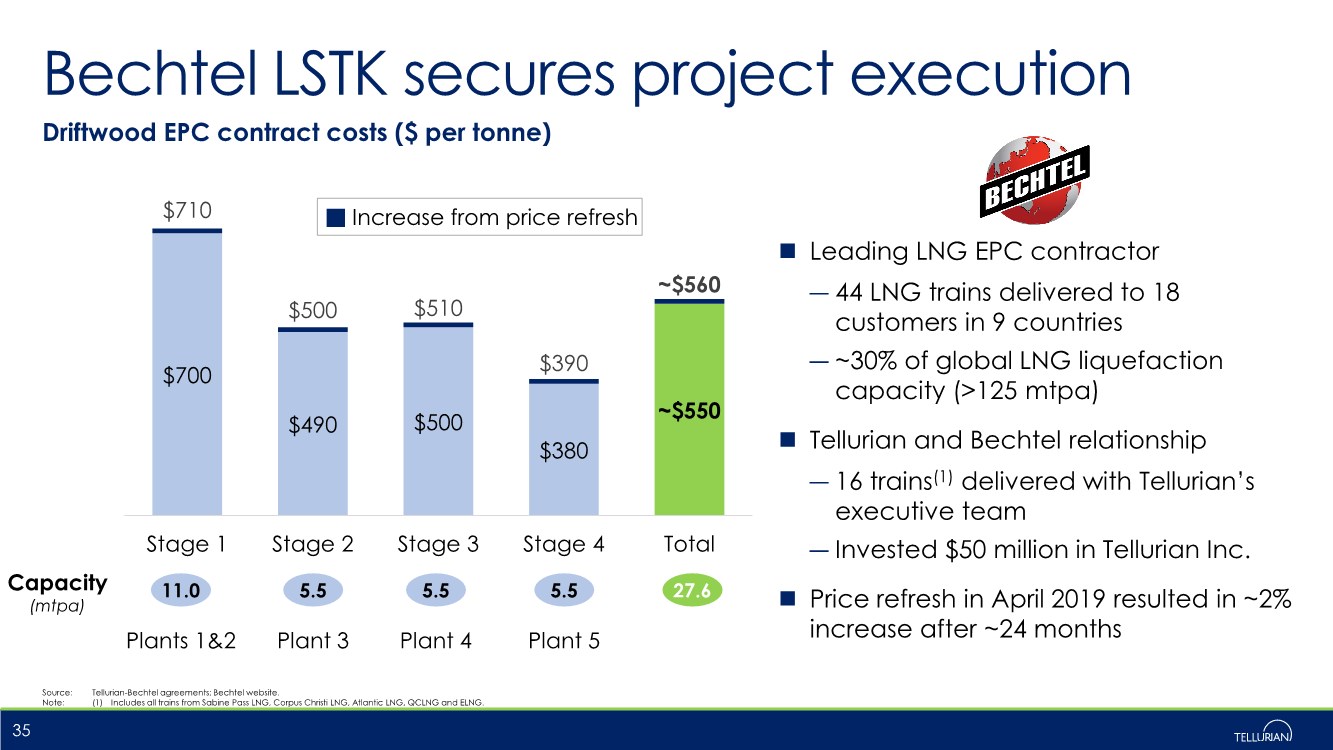
| $700 $490 $500 $380 ~$550 $710 $500 $510 $390 ~$560 Stage 1 Stage 2 Stage 3 Stage 4 Total Bechtel LSTK secures project execution Leading LNG EPC contractor ― 44 LNG trains delivered to 18 customers in 9 countries ― ~30% of global LNG liquefaction capacity (>125 mtpa) Tellurian and Bechtel relationship ― 16 trains(1) delivered with Tellurian’s executive team ― Invested $50 million in Tellurian Inc. Price refresh in April 2019 resulted in ~2% increase after ~24 months Source: Tellurian-Bechtel agreements; Bechtel website. Note: (1) Includes all trains from Sabine Pass LNG, Corpus Christi LNG, Atlantic LNG, QCLNG and ELNG. 35 Capacity (mtpa) 11.0 5.5 5.5 5.5 27.6 Plants 1&2 Plant 3 Plant 4 Plant 5 Increase from price refresh Driftwood EPC contract costs ($ per tonne) |
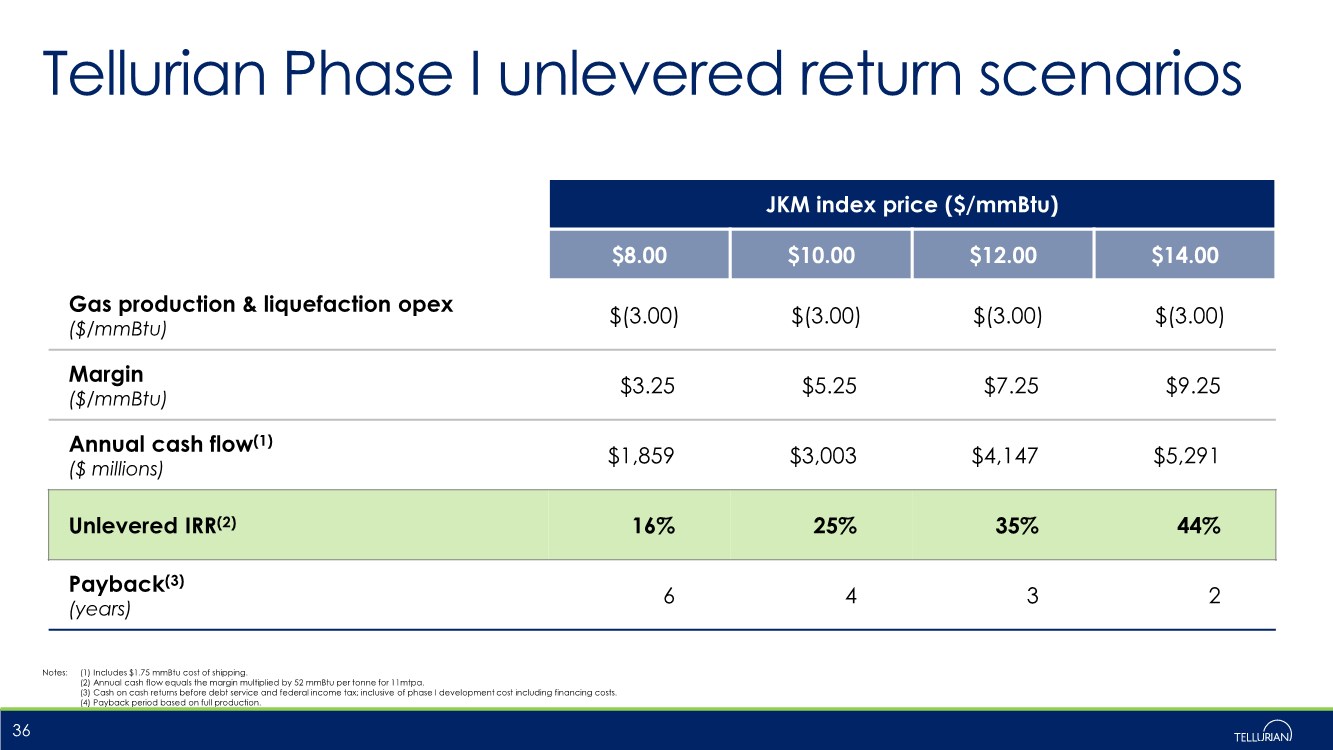
| JKM index price ($/mmBtu) $8.00 $10.00 $12.00 $14.00 Gas production & liquefaction opex ($/mmBtu) $(3.00) $(3.00) $(3.00) $(3.00) Margin ($/mmBtu) $3.25 $5.25 $7.25 $9.25 Annual cash flow(1) ($ millions) $1,859 $3,003 $4,147 $5,291 Unlevered IRR(2) 16% 25% 35% 44% Payback(3) (years) 6 4 3 2 Tellurian Phase I unlevered return scenarios Notes: (1) Includes $1.75 mmBtu cost of shipping. (2) Annual cash flow equals the margin multiplied by 52 mmBtu per tonne for 11mtpa. (3) Cash on cash returns before debt service and federal income tax; inclusive of phase I development cost including financing costs. (4) Payback period based on full production. 36 |