Corporate July 2019 presentation
Cautionary statements Forward-looking statements Plans for the Permian Global Access Pipeline, Haynesville Global Access Pipeline and Delhi Connector Pipeline projects discussed herein are in the early stages of development and numerous aspects of the projects, such as detailed engineering and permitting, have not commenced. Accordingly, the nature, timing, scope and benefits of those projects may vary significantly from our current plans due to a wide variety of factors, including future changes to the proposals. Although the Driftwood pipeline project is significantly more advanced in terms of engineering, permitting and other factors, its construction, budget and timing are also subject to significant risks and uncertainties. The information in this presentation includes “forward-looking statements” within the meaning of Section 27A of the Securities Act of 1933, as amended, and Section 21E of the Securities Exchange Act of 1934, as amended. All statements other than statements of historical fact are forward-looking statements. The words “anticipate,” “assume,” “believe,” “budget,” “estimate,” “expect,” “forecast,” “initial,” “intend,” “may,” “model,” “plan,” “potential,” “project,” “should,” “will,” “would,” and similar expressions are intended to identify forward-looking statements. The forward-looking statements in this presentation relate to, among other things, future contracts and contract terms, expected partners and customers, the parties’ ability to complete contemplated transactions (including, where applicable, to enter into definitive agreements related to those transactions), margins, returns and payback periods, future assets, cash flows, production, delivery of LNG, required infrastructure, future costs, prices, financial results, equity values, liquidity and financing, including equity funding and debt syndication, regulatory and permitting developments, construction and permitting of pipelines and other facilities, reaching FID, future demand and supply affecting LNG and general energy markets and other aspects of our business and our prospects and those of other industry participants. Projected future cash flows as set forth herein may differ from cash flows determined in accordance with GAAP. We may not be able to complete the anticipated transactions described in the presentation. FID is subject to the completion of financing arrangements that may not be completed within the time frame expected or at all. Achieving FID will require substantial amounts of financing in addition to that contemplated by the agreements between Total and Tellurian discussed in this presentation, and Tellurian believes that it may enter into discussions with potential sources of such financing and Total in order to achieve commercial terms acceptable to all parties. Accordingly, final agreements may have terms that differ significantly from those described in the presentation. Our forward-looking statements are based on assumptions and analyses made by us in light of our experience and our perception of historical trends, current conditions, expected future developments, and other factors that we believe are appropriate under the circumstances. These statements are subject to numerous known and unknown risks and uncertainties which may cause actual results to be materially different from any future results or performance expressed or implied by the forward-looking statements. These risks and uncertainties include those described in the “Risk Factors” section of our Annual Report on Form 10-K for the fiscal year ended December 31, 2018, and our other filings with the Securities and Exchange Commission, which are incorporated by reference in this presentation. Many of the forward-looking statements in this presentation relate to events or developments anticipated to occur numerous years in the future, which increases the likelihood that actual results will differ materially from those indicated in such forward-looking statements. The financial information included on slides 6, 16, 19-21 and 28 is meant for illustrative purposes only and does not purport to show estimates of actual future financial performance. The information on those slides assumes the completion of certain acquisition, financing and other transactions. Such transactions may not be completed on the assumed terms or at all. Actual commodity prices may vary materially from the commodity prices assumed for the purposes of the illustrative financial performance information. The forward-looking statements made in or in connection with this presentation speak only as of the date hereof. Although we may from time to time voluntarily update our prior forward-looking statements, we disclaim any commitment to do so except as required by securities laws. Reserves and resources Estimates of non-proved reserves and resources are based on more limited information, and are subject to significantly greater risk of not being produced, than are estimates of proved reserves. 2
Corporate updates 3
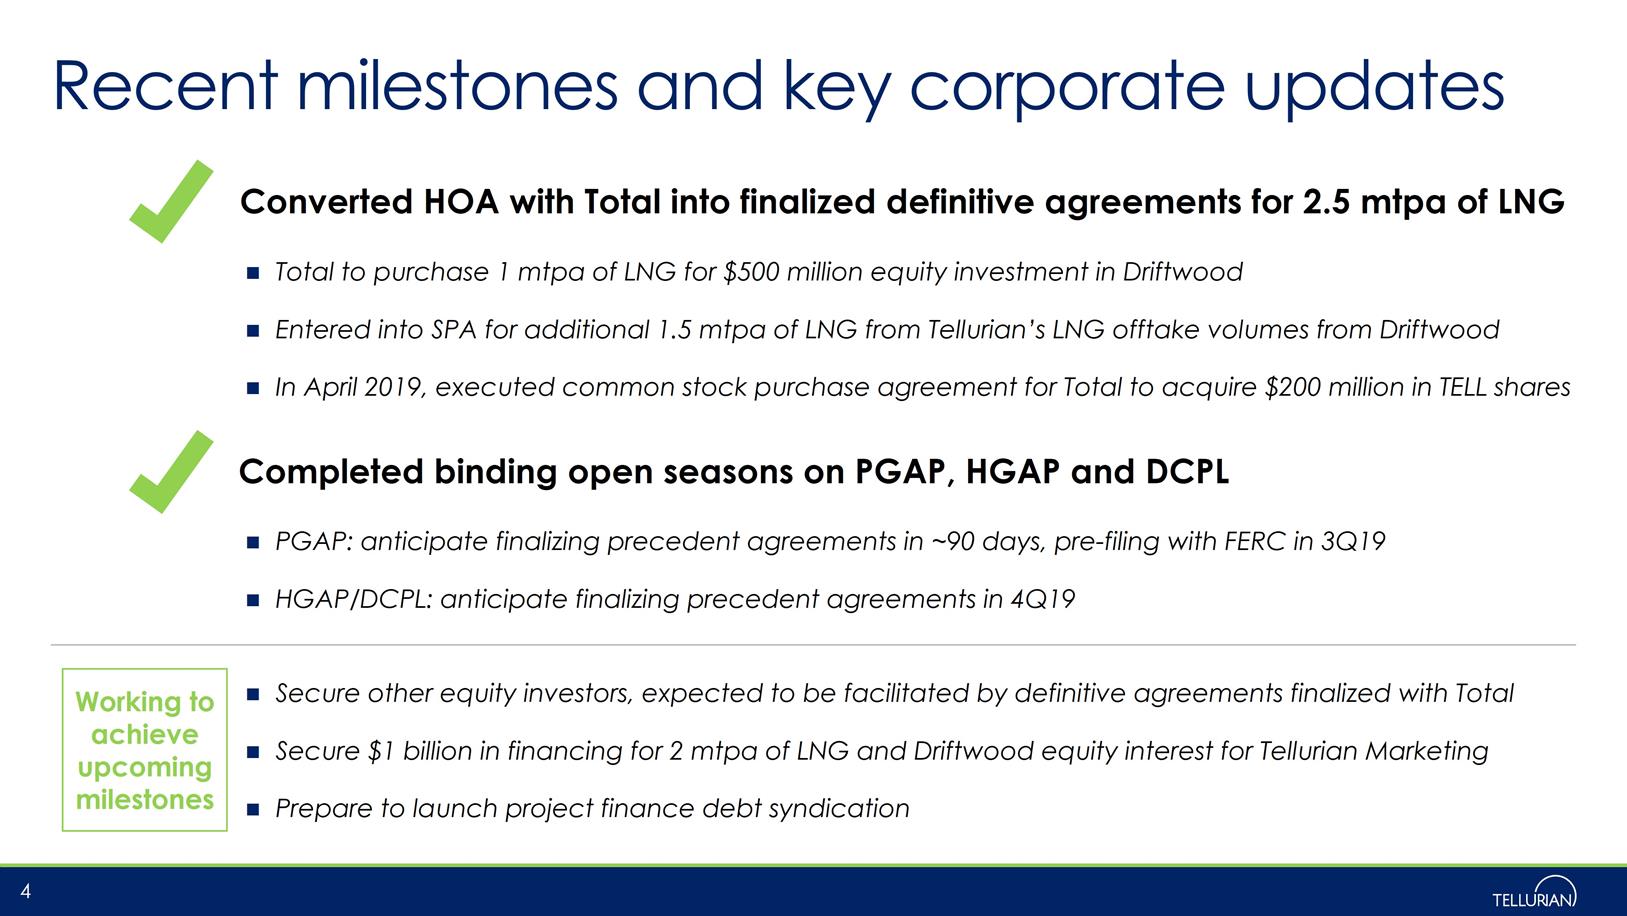
Recent milestones and key corporate updates Converted HOA with Total into finalized definitive agreements for 2.5 mtpa of LNG Total to purchase 1 mtpa of LNG for $500 million equity investment in Driftwood Entered into SPA for additional 1.5 mtpa of LNG from Tellurian Marketing’s LNG volumes from Driftwood In April 2019, executed common stock purchase agreement for Total to acquire $200 million in TELL shares Completed binding open seasons on PGAP, HGAP and DCPL PGAP: anticipate finalizing precedent agreements in ~90 days, pre-filing with FERC in 3Q19 HGAP/DCPL: anticipate finalizing precedent agreements in 4Q19 Secure other equity investors, expected to be facilitated by definitive agreements finalized with Total Secure $1 billion in financing for 2 mtpa of LNG and Driftwood equity interest for Tellurian Marketing Prepare to launch project finance debt syndication 4 Working to achieve upcoming milestones
Business overview 5

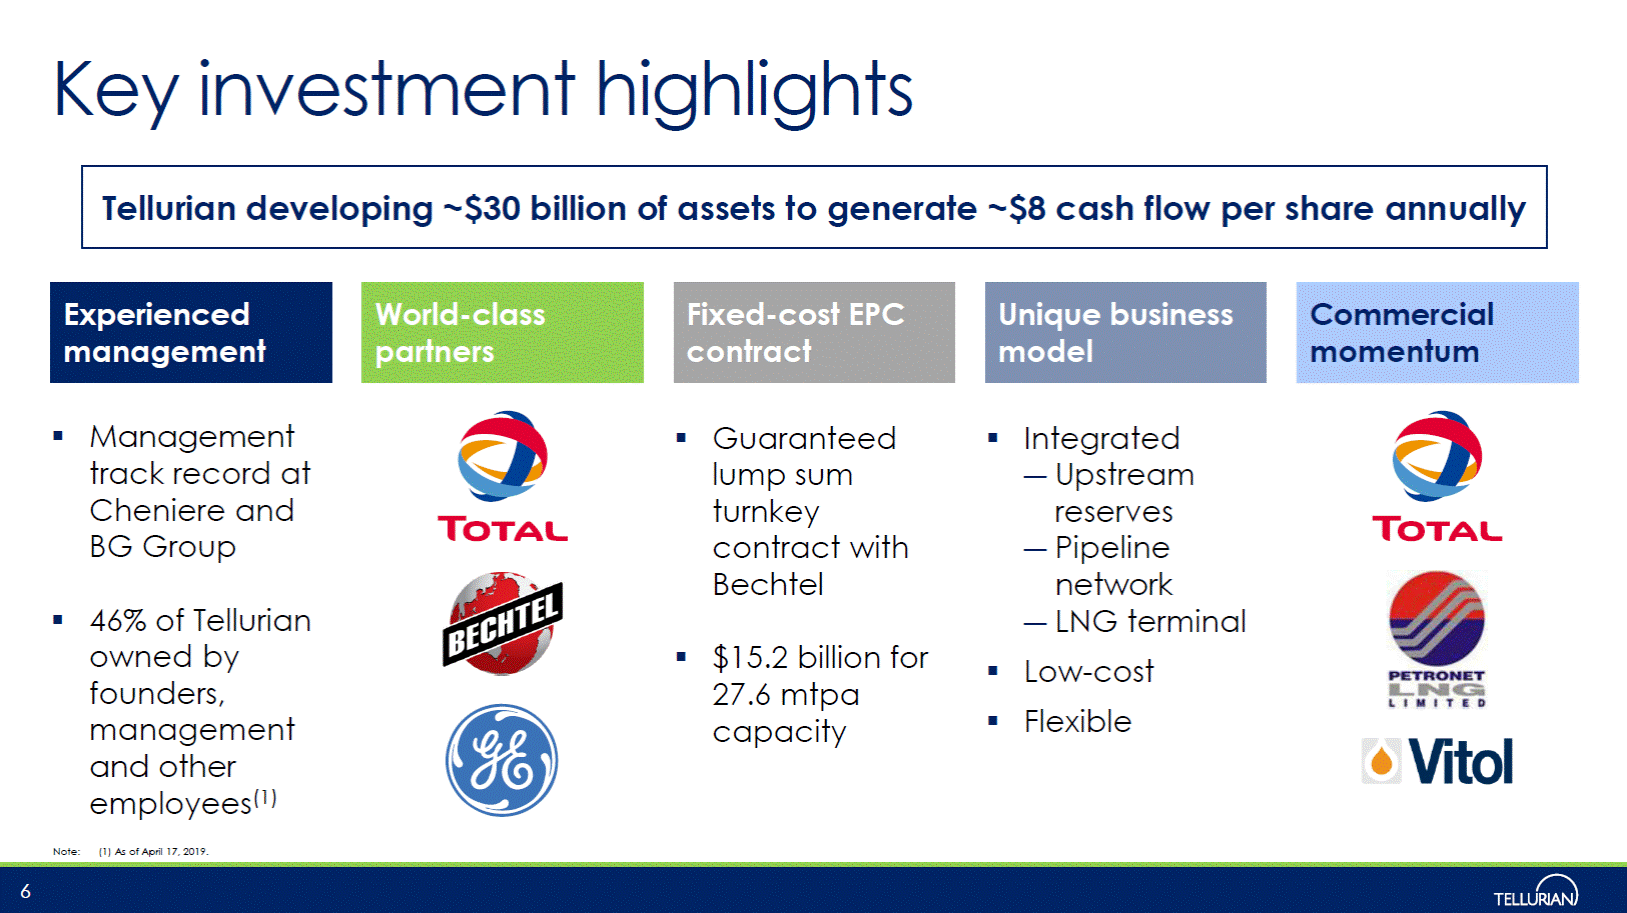
Key investment highlights Management track record at Cheniere and BG Group Guaranteed lump sum turnkey Integrated – Upstream reserves – Pipeline network – LNG terminal Low-cost Flexible contract Bechtel with 46% of Tellurian owned by founders, management and other employees(1) (1) As of April 17, 2019. $15.2 billion for 27.6 mtpa capacity Note: 6 Unique business model Experienced management Commercial momentum Fixed-cost EPC contract World-class partners Tellurian developing ~$30 billion of assets to generate ~$8 cash flow per share annually
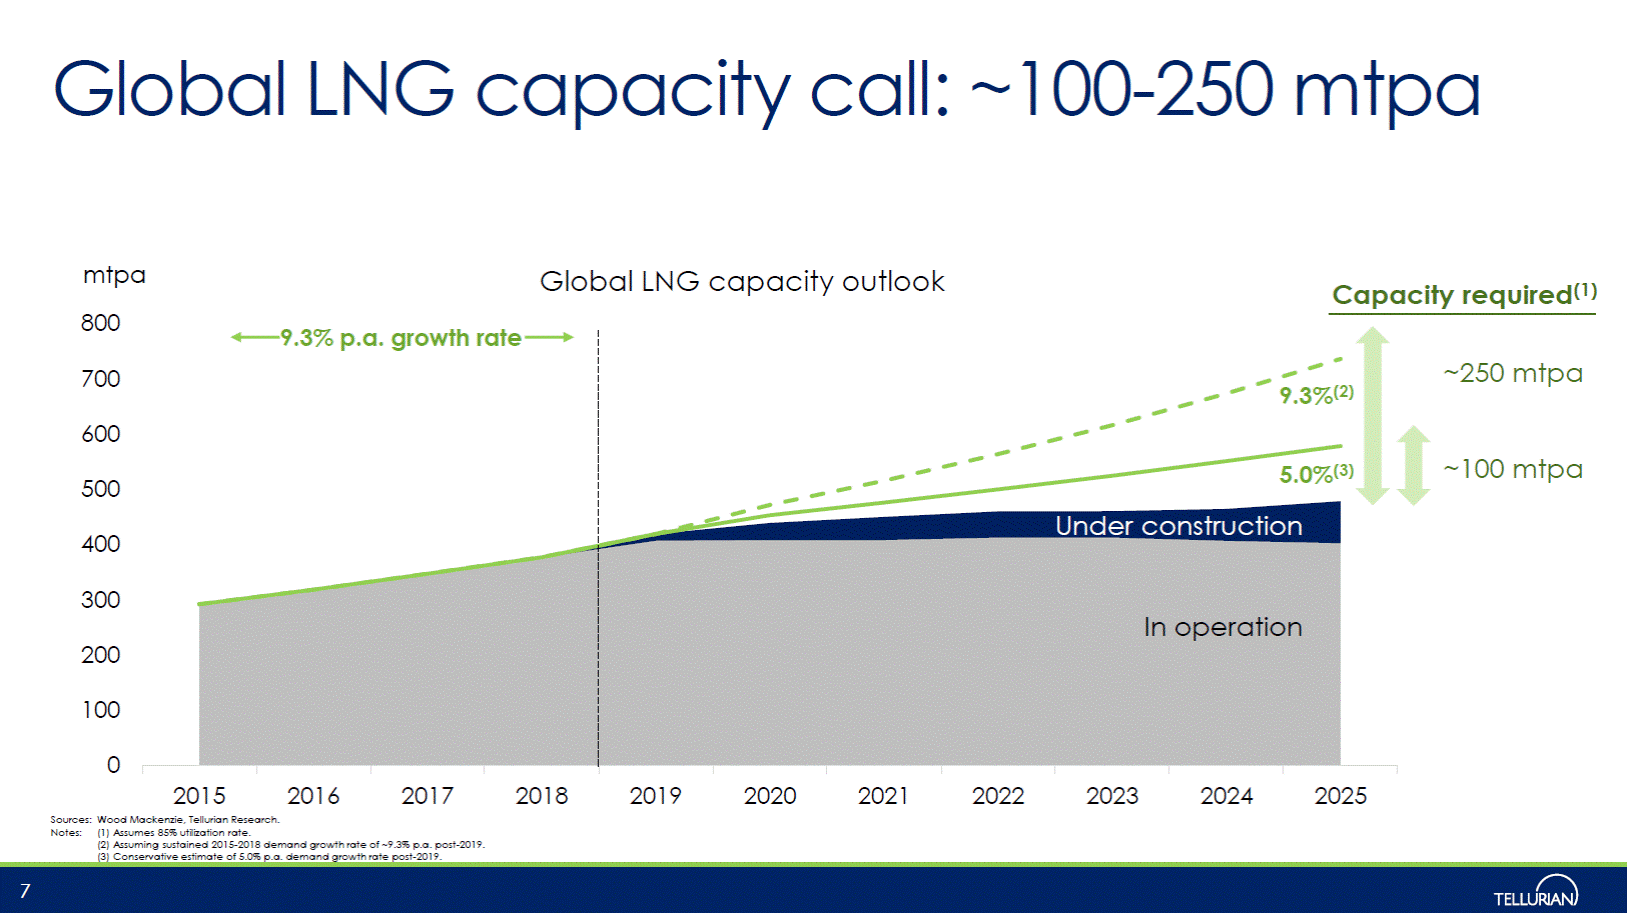
Global LNG capacity call: ~100-250 mtpa mtpa Global LNG capacity outlook Capacity required(1) 800 ~250 mtpa 700 600 ~100 mtpa 500 400 300 200 100 0 2015 Sources: Wood Mackenzie, Tellurian Research. Notes: (1) Assumes 85% utilization rate. 2016 2017 2018 2019 2020 2021 2022 2023 2024 2025 (2) Assuming sustained 2015-2018 demand growth rate of ~9.3% p.a. post-2019. (3) Conservative estimate of 5.0% p.a. demand growth rate post-2019. 7 9.3% p.a. growth rate 9.3%(2) 5.0%(3) Under construction In operation
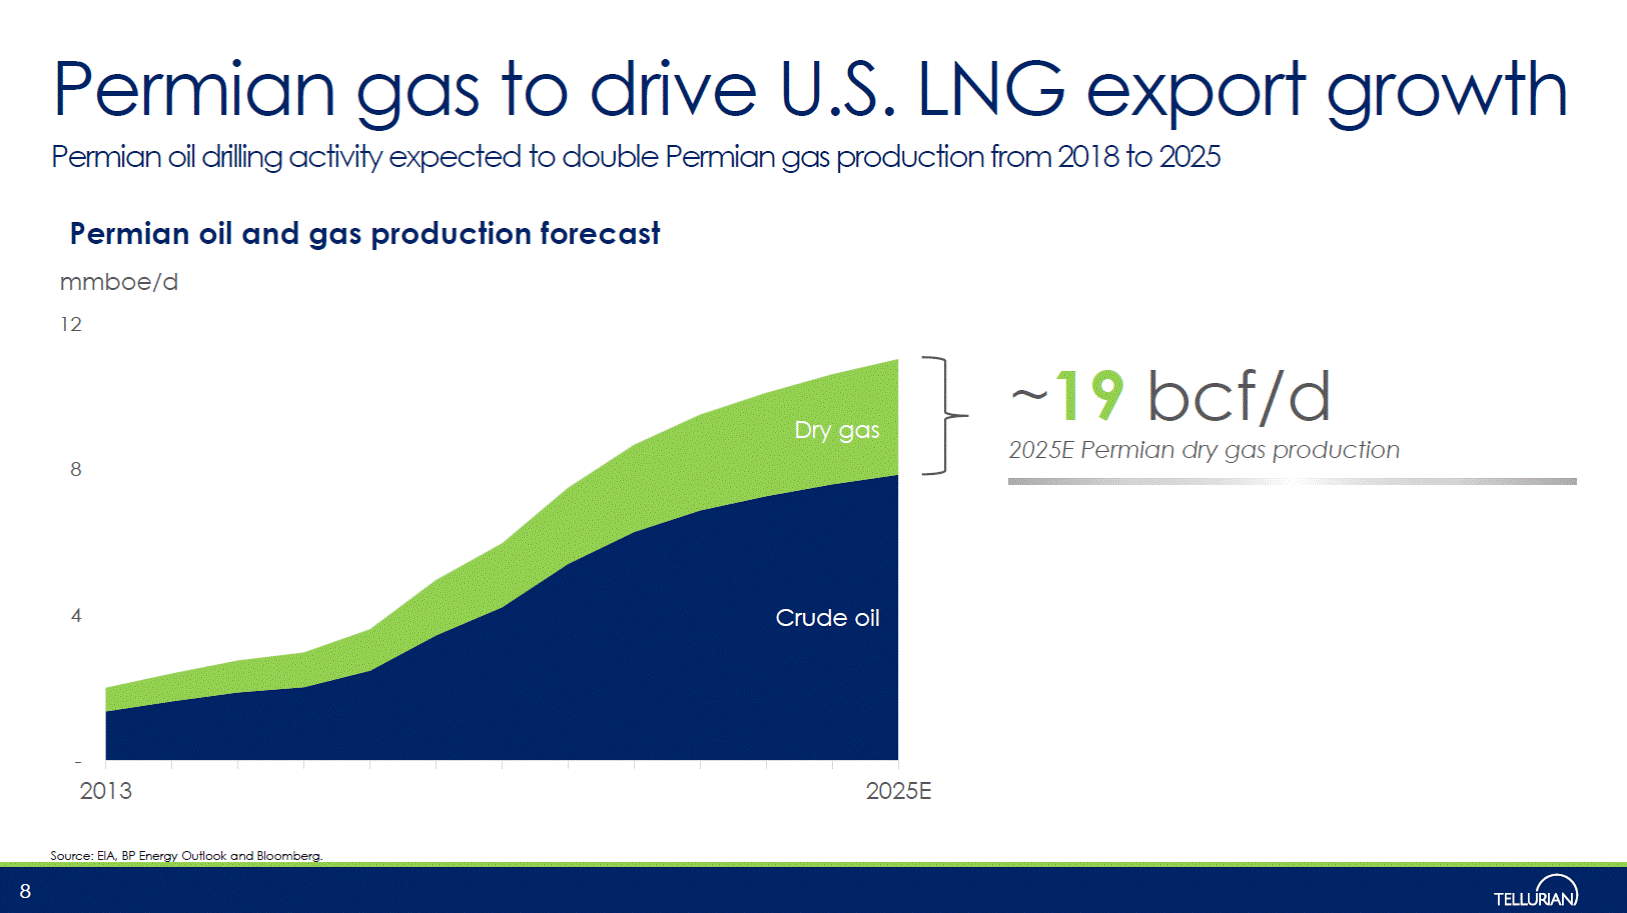
Permian gas to drive U.S. LNG export Permian oil drilling activity expected to double Permian gas production from 2018 to 2025 growth Permian oil mmboe/d 12 and gas production forecast ~19 bcf/d 2025E Permian dry gas production Dry gas 8 4 Crude oil - 2013 2025E Source: EIA, BP Energy Outlook and Bloomberg. 8
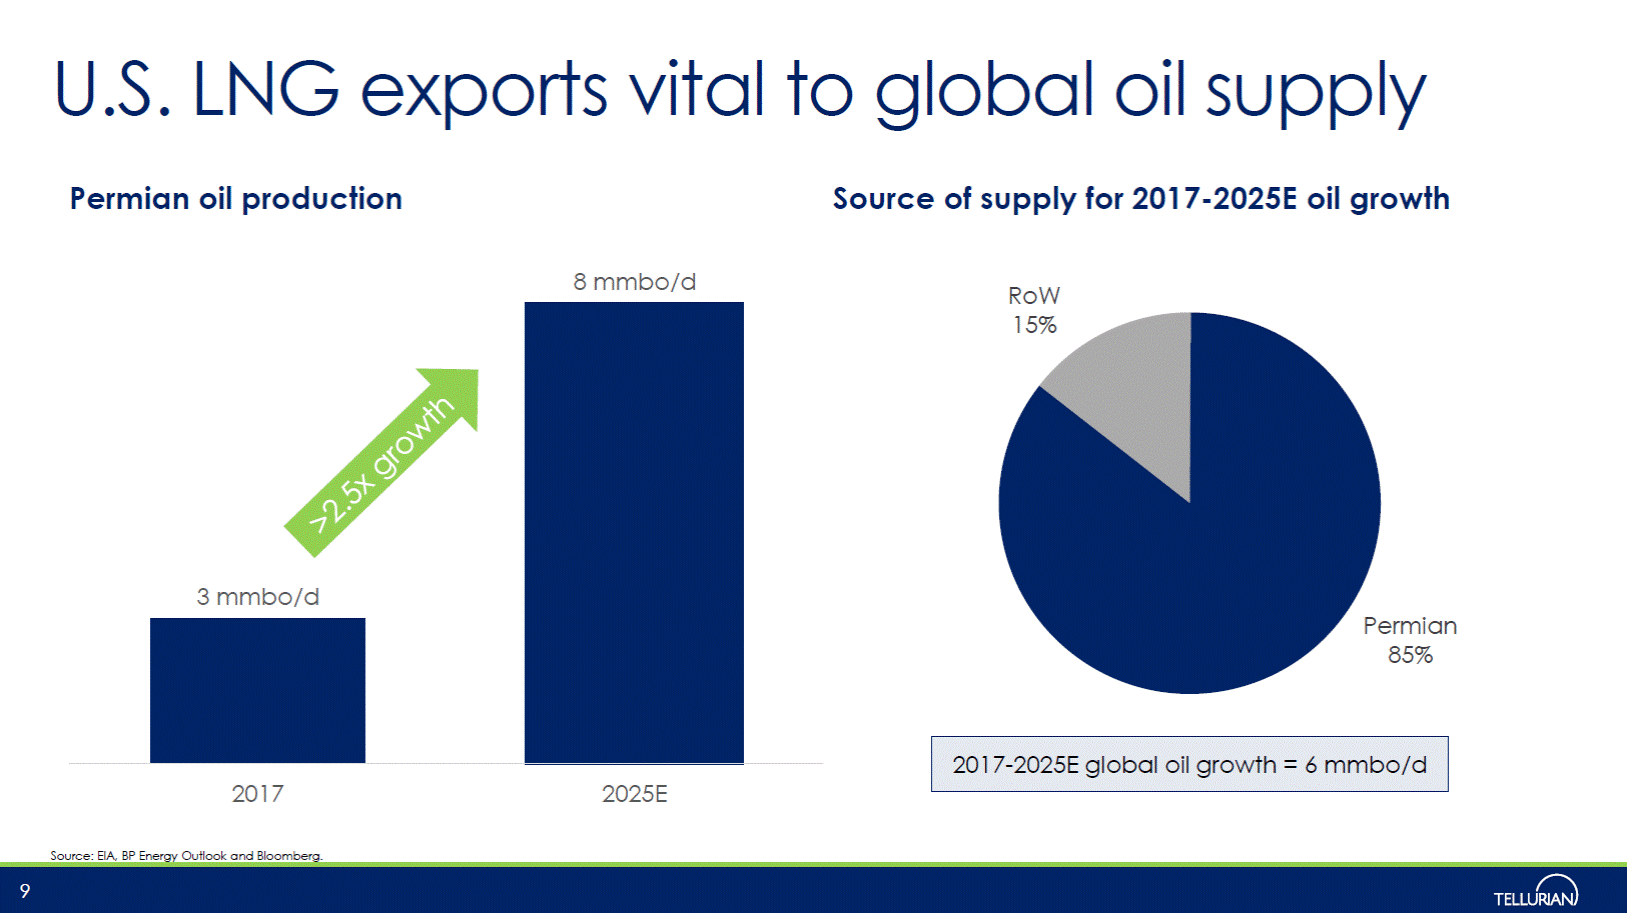
U.S. LNG exports vital to global oil supply Permian oil production Source of supply for 2017-2025E oil growth 8 mmbo/d RoW 15% Permian 85% 2017 2025E Source: EIA, BP Energy Outlook and Bloomberg. 9 2017-2025E global oil growth = 6 mmbo/d 3 mmbo/d
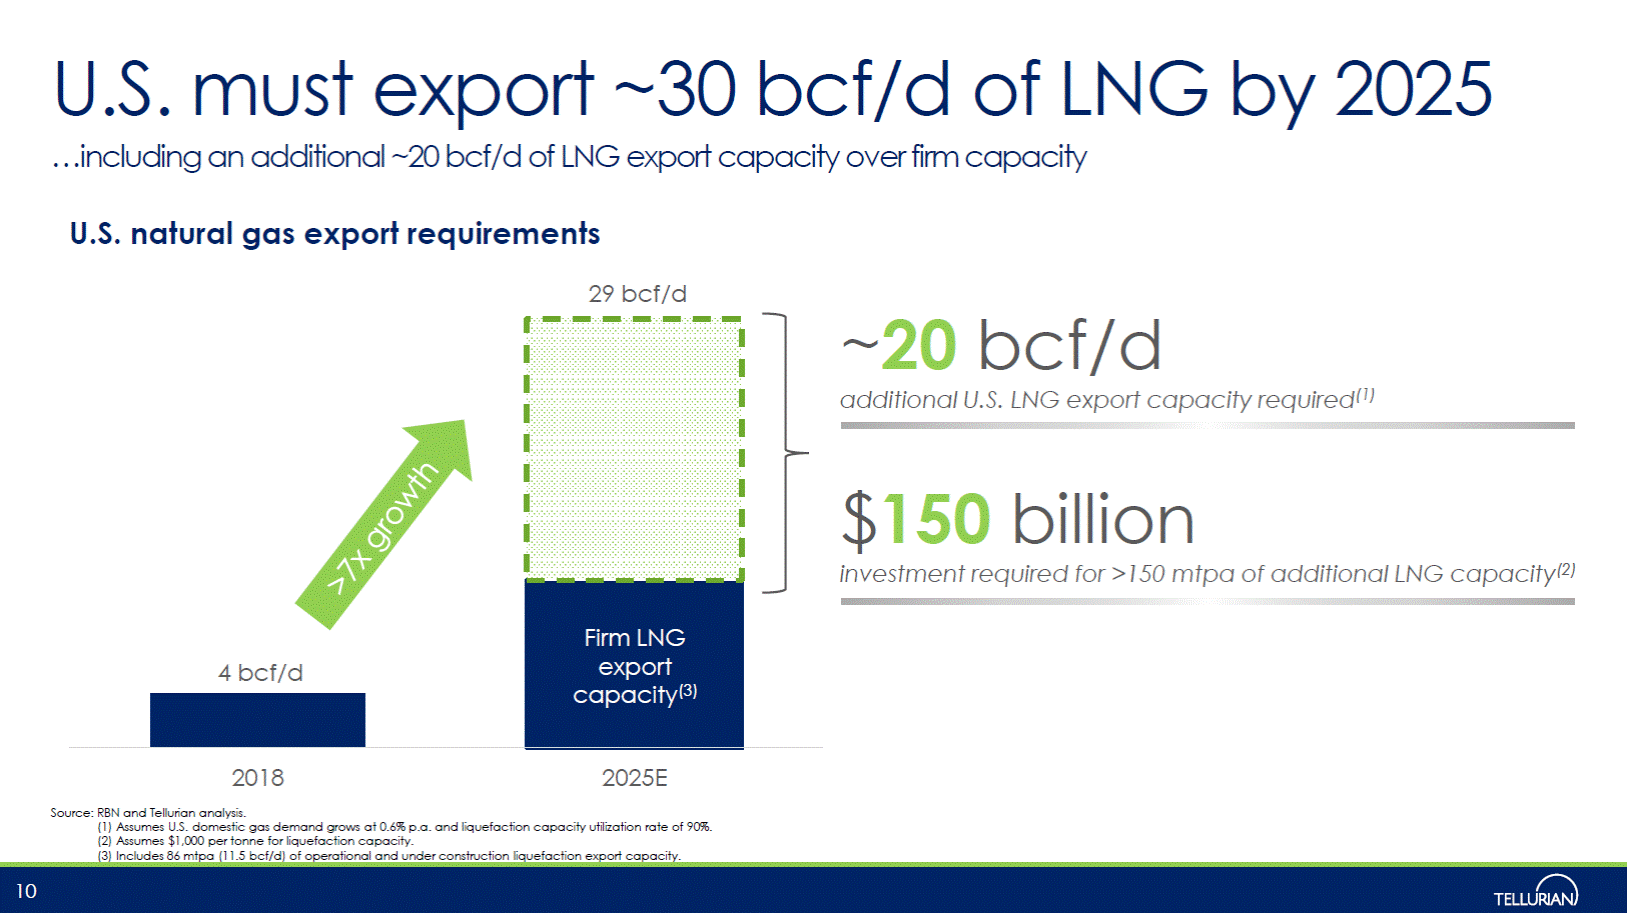
U.S. must export ~30 bcf/d of LNG …including an additional ~20 bcf/d of LNG export capacity over firm capacity by 2025 U.S. natural gas export requirements 29 bcf/d ~20 bcf/d additional U.S. LNG export capacity required(1) $150billion investment required for >150 mtpa of additional LNG capacity(2) capacity(3) 2018 Source: RBN and Tellurian analysis. 2025E (1) Assumes U.S. domestic gas demand grows at 0.6% p.a. and liquefaction capacity utilization rate of 90%. (2) Assumes $1,000 per tonne for liquefaction capacity. (3) Includes 86 mtpa (11.5 bcf/d) of operational and under construction liquefaction export capacity. 10 4 bcf/d Firm LNG export
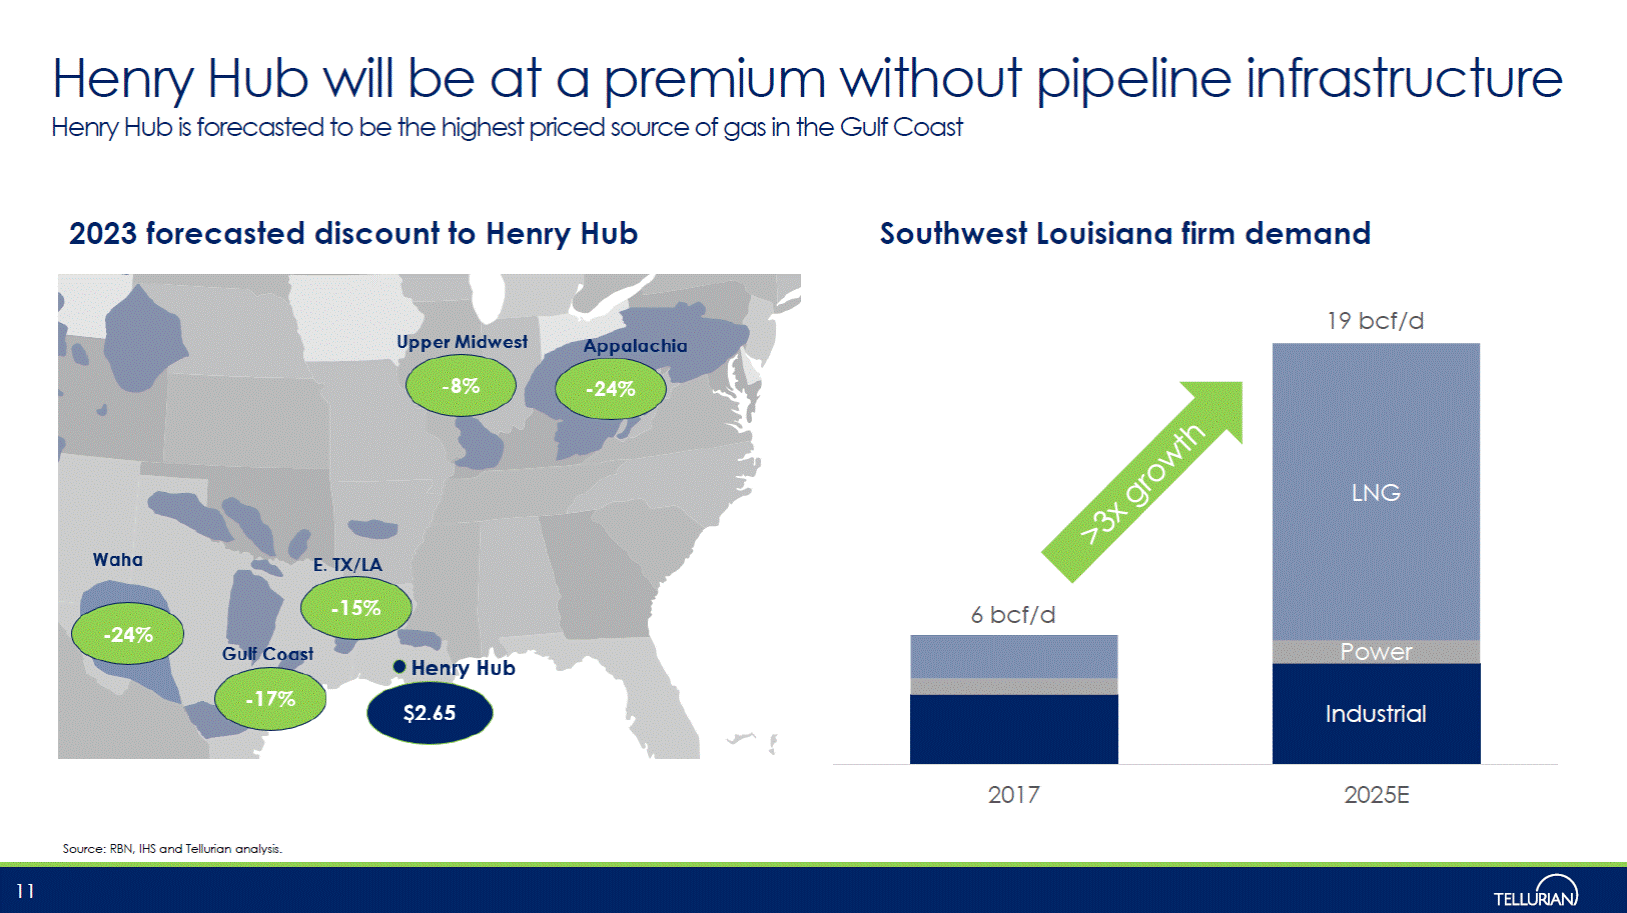
Henry Hub will be at a premium without pipeline Henry Hub is forecasted to be the highest priced source of gas in the Gulf Coast infrastructure 2023 forecasted discount to Henry Hub Southwest Louisiana firm demand 19 bcf/d 2017 2025E Source: RBN, IHS and Tellurian analysis. 11 6 bcf/d LNG Power Industrial
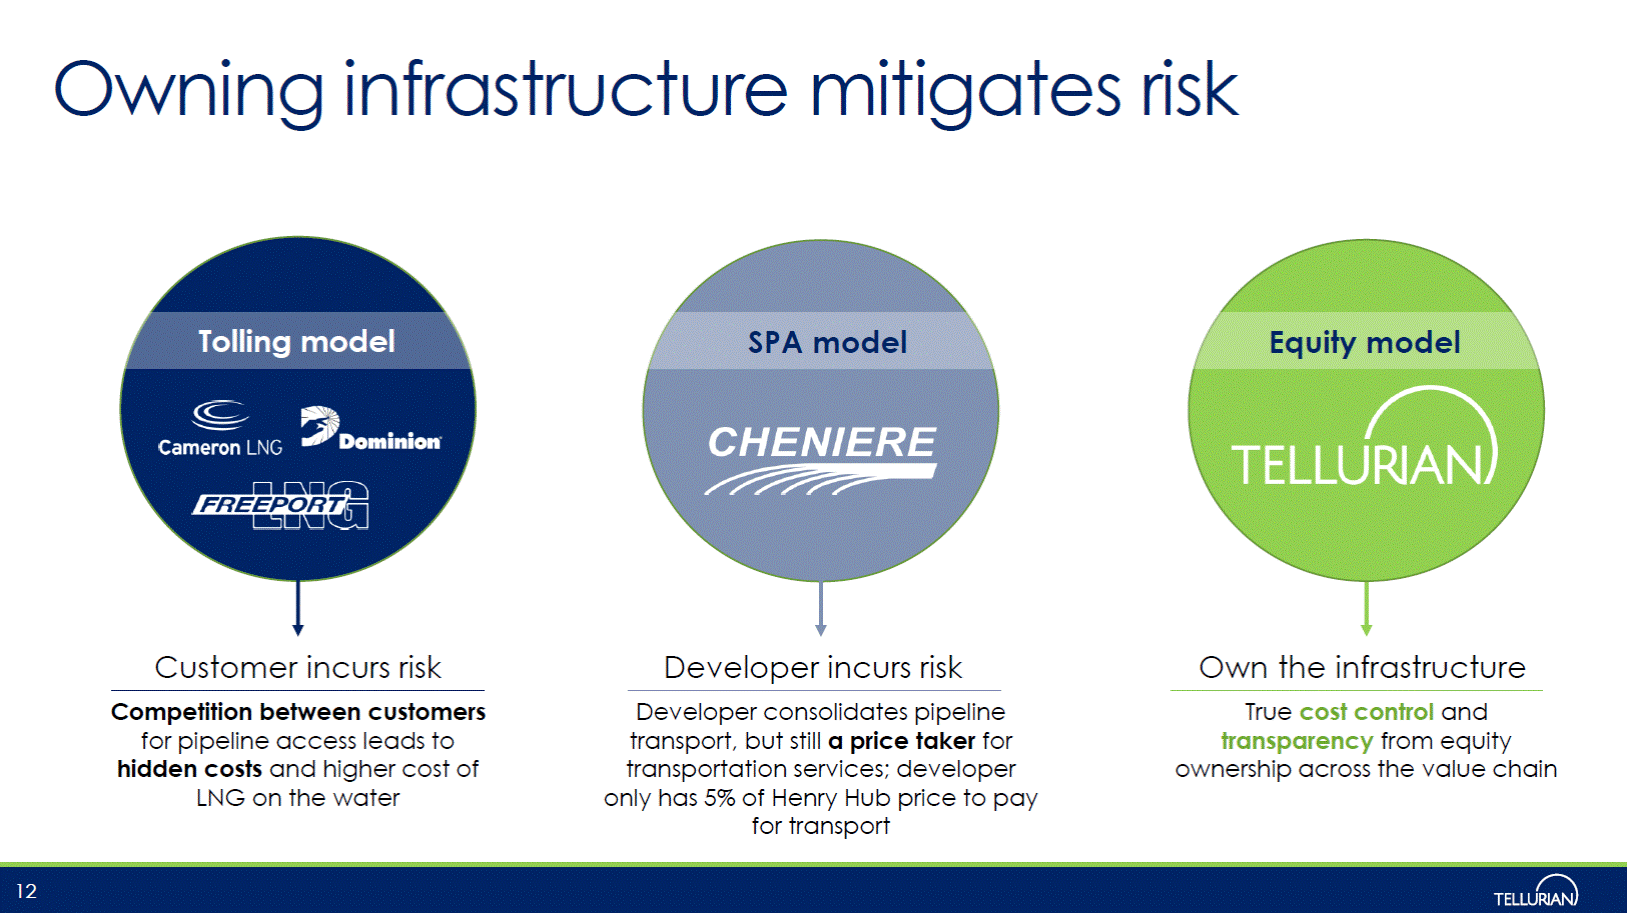
Owning infrastructure mitigates risk SPA model Equity model Customer incurs risk Developer incurs risk Own the infrastructure Developer consolidates pipeline transport, but still a price taker for transportation services; developer only has 5% of Henry Hub price to pay for transport True cost control and transparency from equity ownership across the value chain Competition between customers for pipeline access leads to hidden costs and higher cost of LNG on the water 12
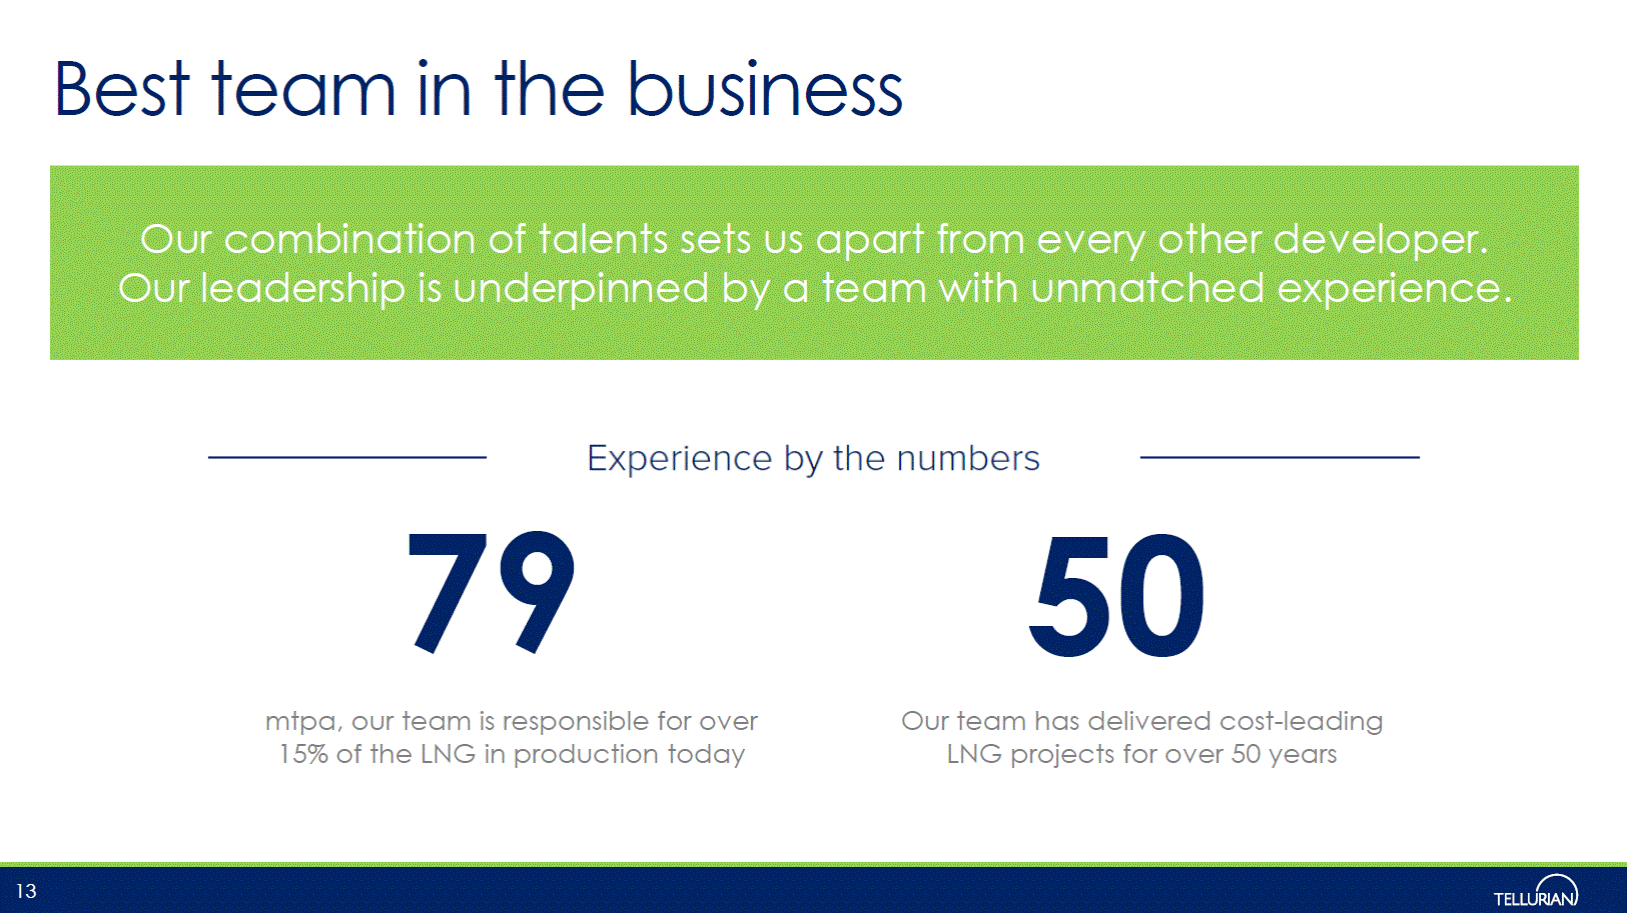
Best team in the business 79 50 mtpa, our team is responsible for over 15% of the LNG in production today Our team has delivered cost-leading LNG projects for over 50 years 13 Our combination of talents sets us apart from every other developer. Our leadership is underpinned by a team with unmatched experience.
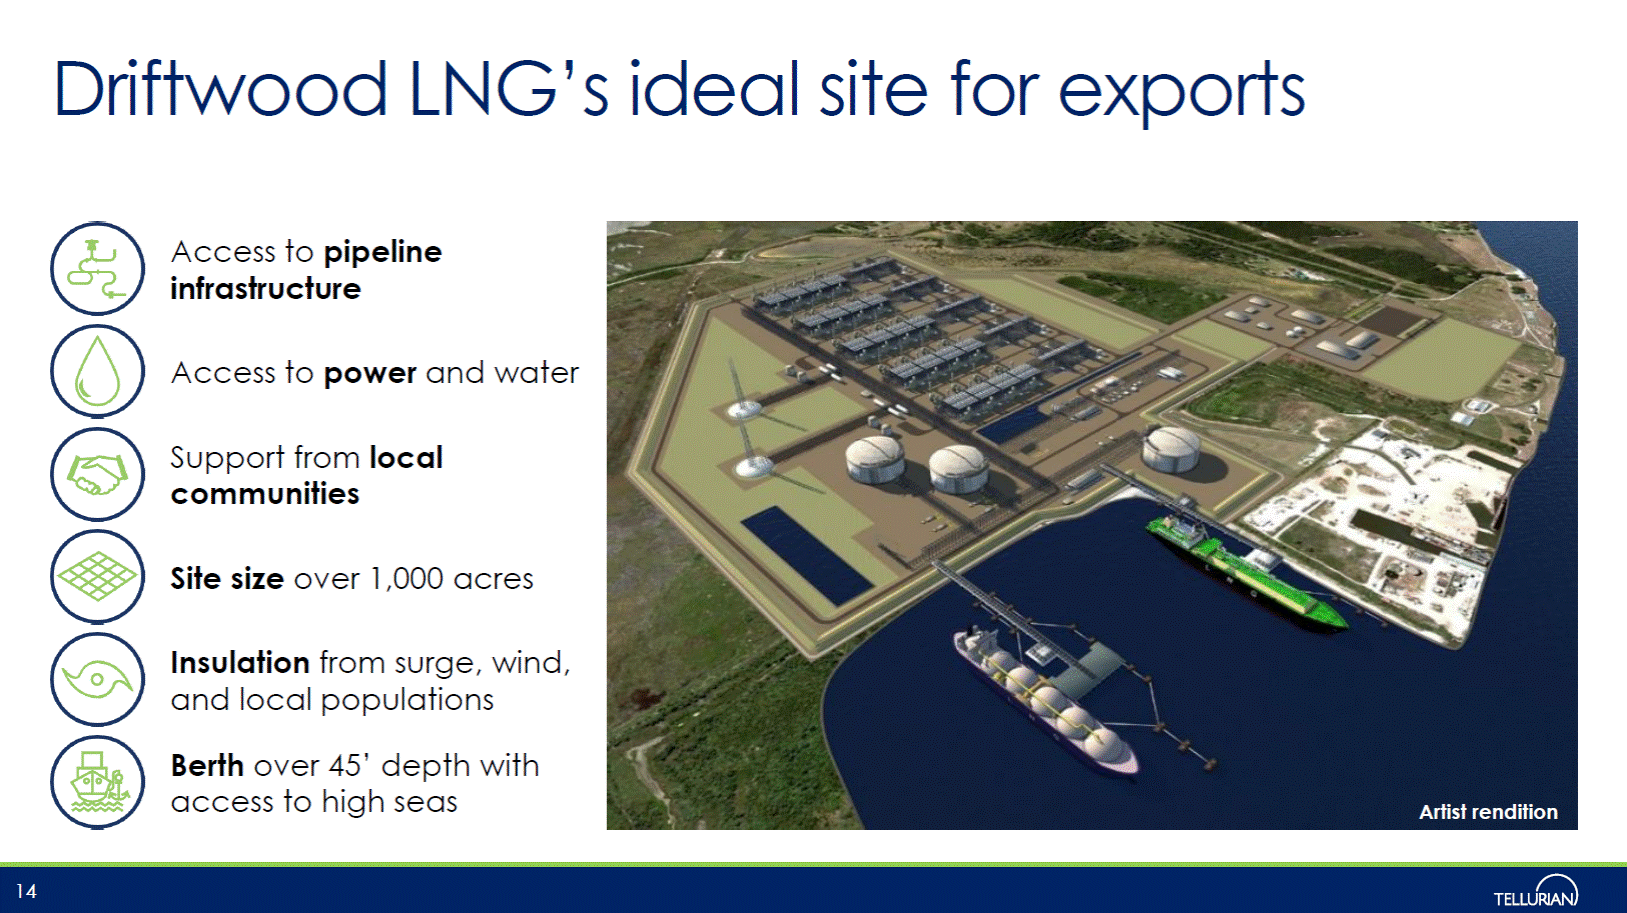
Driftwood LNG’s ideal site for exports Access to pipeline infrastructure Access to power and water Support from local communities Site size over 1,000 acres Insulation from surge, wind, and local populations Berth over 45’ depth with access to high seas Artist rendition 14
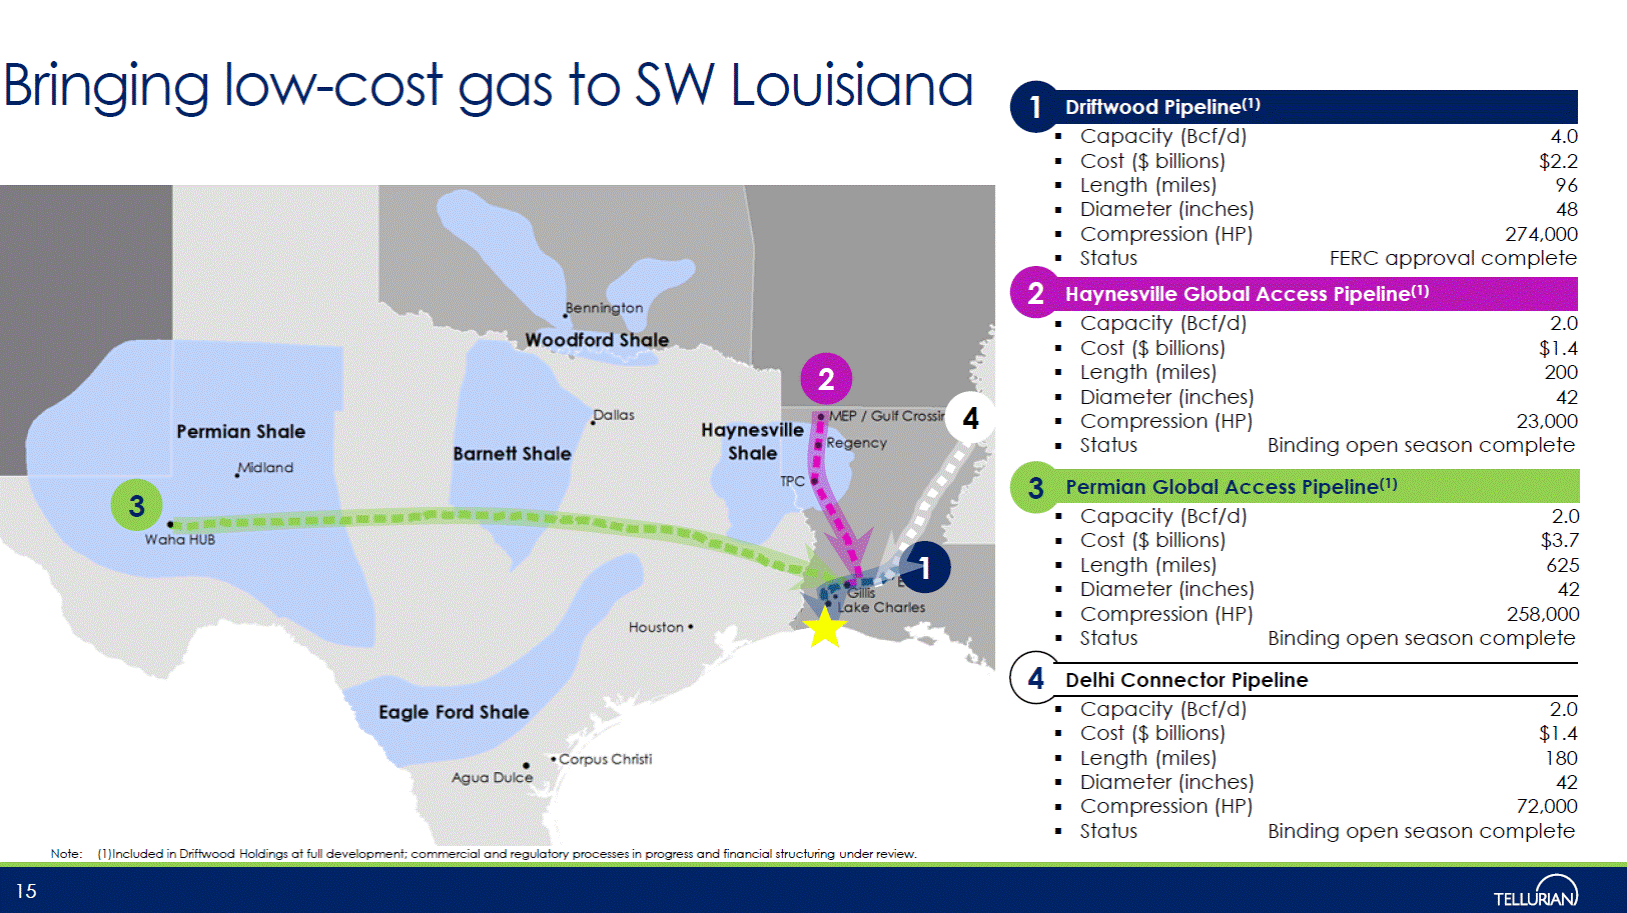
Bringing low-cost gas to SW Louisiana 1 Capacity (Bcf/d) Cost ($ billions) Length (miles) Diameter (inches) Compression (HP) Status 4.0 $2.2 96 48 274,000 FERC approval complete 2 Capacity (Bcf/d) Cost ($ billions) Length (miles) Diameter (inches) Compression (HP) Status 2.0 $1.4 200 42 23,000 Binding open season complete 2 4 3 3 Capacity (Bcf/d) Cost ($ billions) Length (miles) Diameter (inches) Compression (HP) Status 2.0 $3.7 625 42 258,000 Binding open season complete 1 4 Delhi Connector Pipeline Capacity (Bcf/d) Cost ($ billions) Length (miles) Diameter (inches) Compression (HP) Status 2.0 $1.4 180 42 72,000 Binding open season complete Note: (1)Included in Driftwood Holdings at full development; commercial and regulatory processes in progress and financial structuring under review. 15 Permian Global Access Pipeline(1) Haynesville Global Access Pipeline(1) Driftwood Pipeline(1)
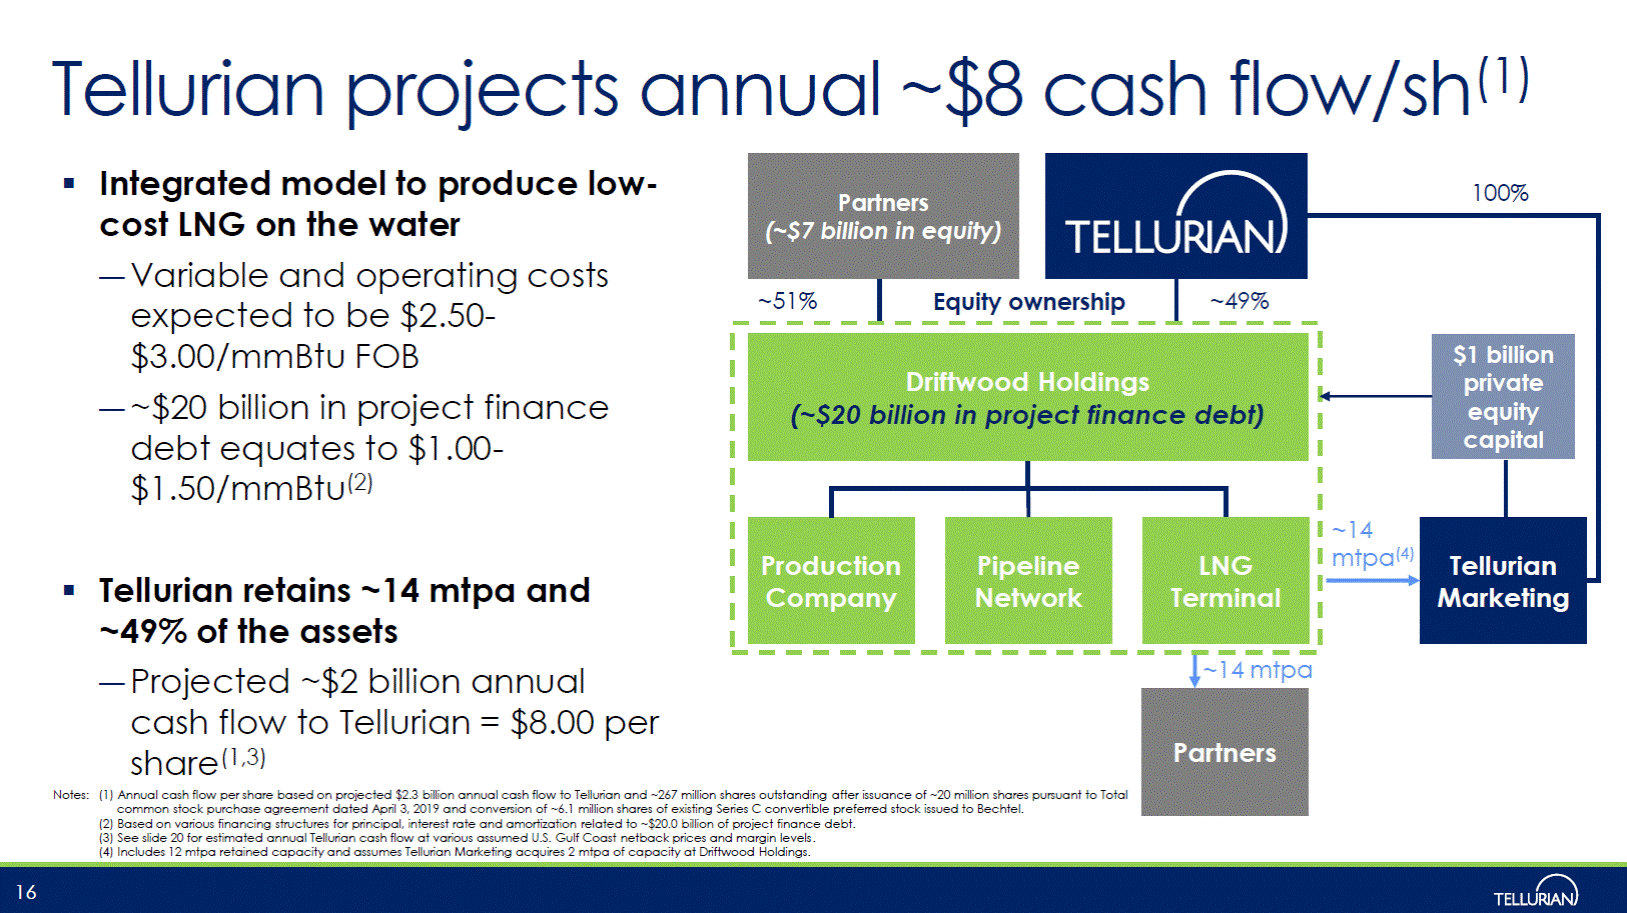
flow/sh(1) Tellurian projects annual ~$8 cash Integrated model to produce low-cost LNG on the water – Variable and operating costs expected to be $2.50-$3.00/mmBtu FOB – ~$20 billion in project finance debt equates to $1.00-$1.50/mmBtu(2) Tellurian retains ~14 mtpa and ~49% of the assets – Projected ~$2 billion annual cash flow to Tellurian = $8.00 per share(1,3) ~14 mtpa Notes: (1) Annual cash flow per share based on projected $2.3 billion annual cash flow to Tellurian and ~267 million shares outstanding after issuance of ~20 million shares pursuant to Total common stock purchase agreement dated April 3, 2019 and conversion of ~6.1 million shares of existing Series C convertible preferred stock issued to Bechtel. (2) Based on various financing structures for principal, interest rate and amortization related to ~$20.0 billion of project finance debt. (3) See slide 20 for estimated annual Tellurian cash flow at various assumed U.S. Gulf Coast netback prices and margin levels . (4) Includes 12 mtpa retained capacity and assumes Tellurian Marketing acquires 2 mtpa of capacity at Driftwood Holdings. 16 Partners Partners (~$7 billion in equity) 100% ~51% Equity ownership ~49% $1 billion private equity capital ~14 mtpa(4) Tellurian Marketing Production Company LNG Terminal Pipeline Network Driftwood Holdings (~$20 billion in project finance debt)
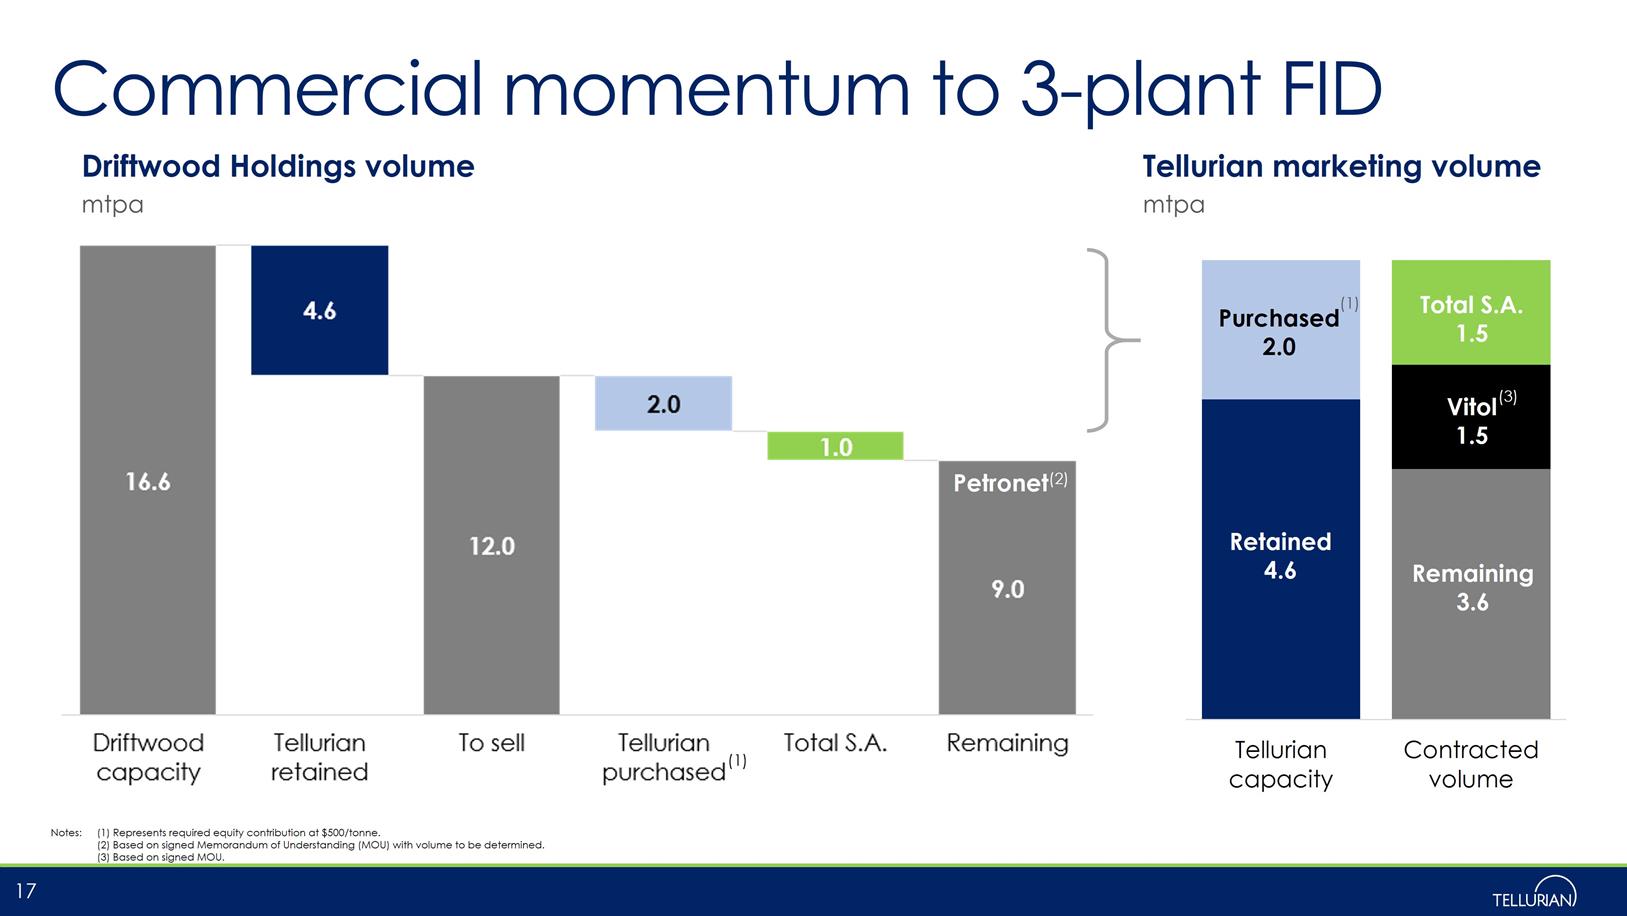
Commercial mtpa momentum to 3-plant FID Tellurian Marketing mtpa Driftwood Holdings volume volume ed Petronet(2) Tellurian capacity Contracted volume (1) Notes: (1) Represents required equity contribution at $500/tonne. (2) Based on signed Memorandum of Understanding (MOU) with volume to be determined. (3) Based on signed MOU. 17 Purchas(1) 2.0 Total S.A. 1.5 Vitol(3) 1.5 Retained 4.6 Remaining 3.6
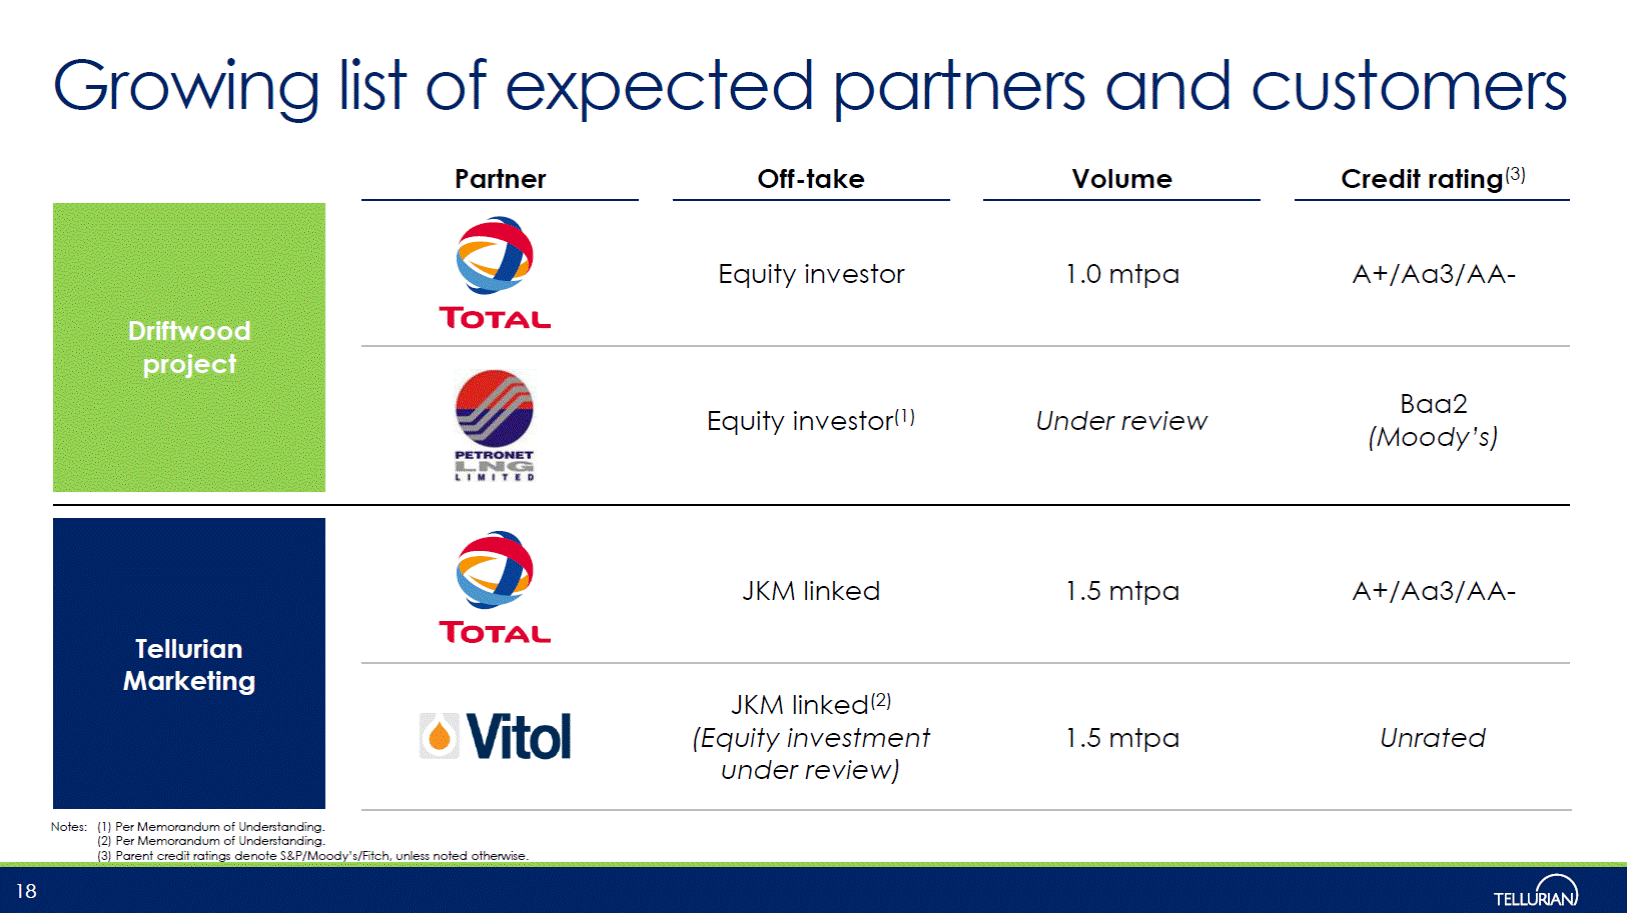
Growing list of expected partners and customers Credit rating(3) Partner Off-take Volume Equity investor 1.0 mtpa (Moody’s) Notes: (1) Per Memorandum of Understanding. (2) Per Memorandum of Understanding. (3) Parent credit ratings denote S&P/Moody’s/Fitch, unless noted otherwise. 18 Driftwood project A+/Aa3/AA-Equity investor(1)Under reviewBaa2 JKM linked1.5 mtpaA+/Aa3/AA-Tellurian Marketing JKM linked(2) (Equity investment1.5 mtpaUnrated under review)
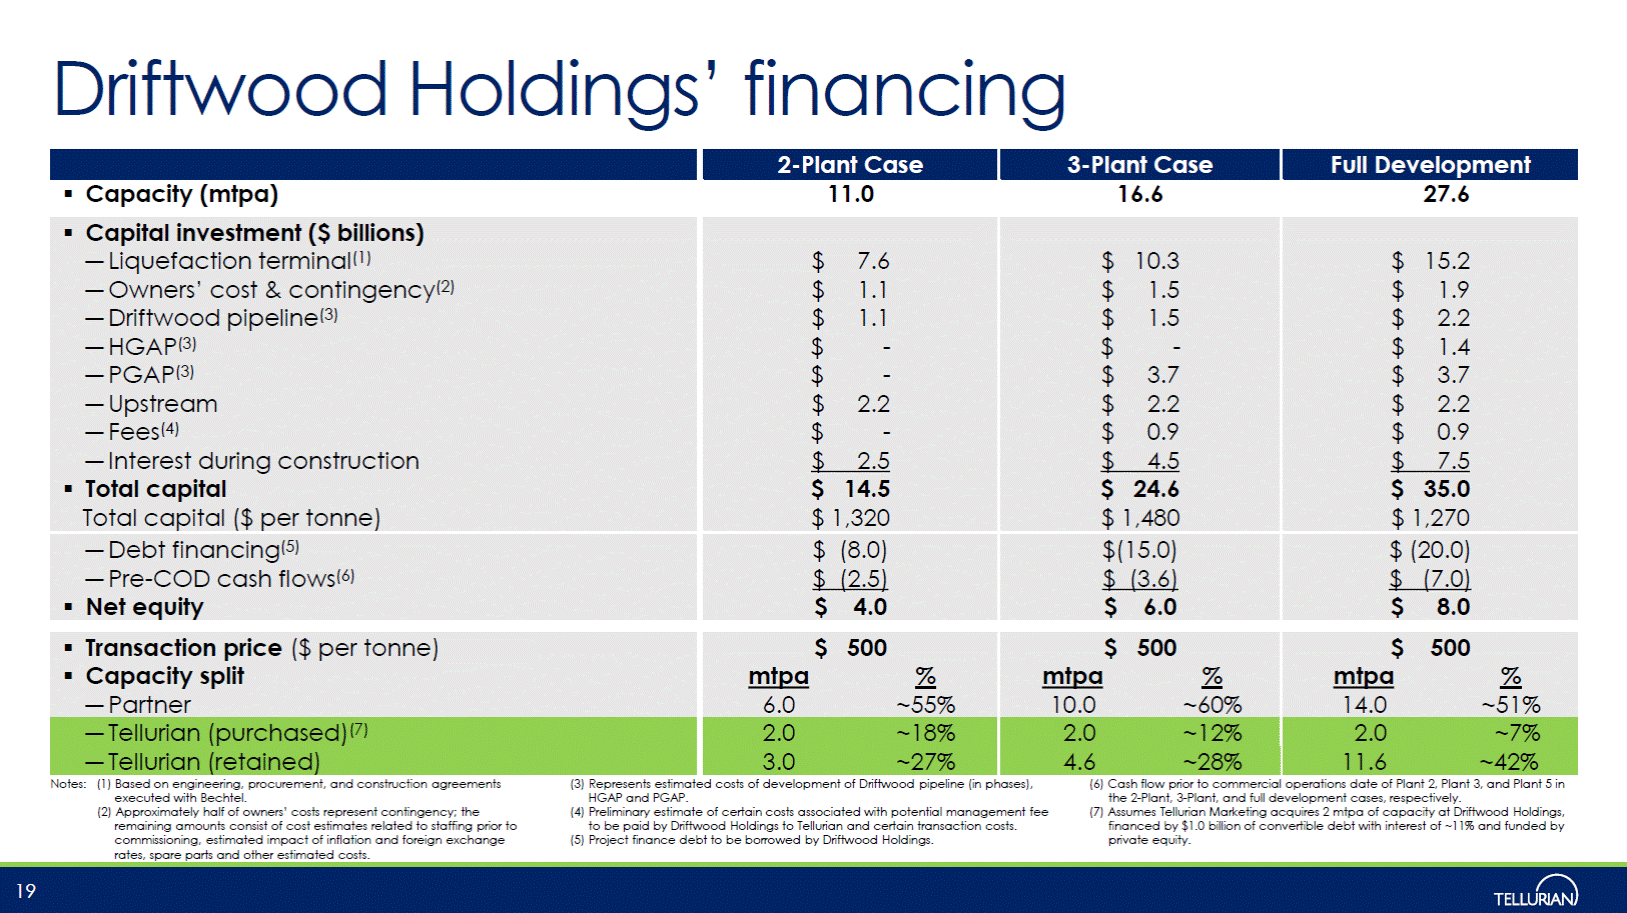
Driftwood Holdings’ financing Capacity (mtpa) 11.0 16.6 27.6 Notes: (1) Based on engineering, procurement, and construction agreements executed with Bechtel. (2) Approximately half of owners’ costs represent contingency; the remaining amounts consist of cost estimates related to staffing prior to commissioning, estimated impact of inflation and foreign exchange rates, spare parts and other estimated costs. (3) Represents estimated costs of development of Driftwood pipeline (in phases), HGAP and PGAP. (4) Preliminary estimate of certain costs associated with potential management fee to be paid by Driftwood Holdings to Tellurian and certain transaction costs. (5) Project finance debt to be borrowed by Driftwood Holdings. (6) Cash flow prior to commercial operations date of Plant 2, Plant 3, and Plant 5 in the 2-Plant, 3-Plant, and full development cases, respectively. (7) Assumes Tellurian Marketing acquires 2 mtpa of capacity at Driftwood Holdings, financed by $1.0 billion of convertible debt with interest of ~11% and funded by private equity. 19 $500 mtpa% 6.0~55% $500 mtpa% 10.0~60% $500 mtpa% 14.0~51% 2.0~18% 3.0~27% 2.0~12% 4.6~28% 2.0~7% 11.6~42% Transaction price ($ per tonne) Capacity split – Partner – Tellurian (purchased)(7) – Tellurian (retained) Capital investment ($ billions) – Liquefaction terminal(1) – Owners’ cost & contingency(2) – Driftwood pipeline(3) – HGAP(3) – PGAP(3) – Upstream – Fees(4) – Interest during construction Total capital Total capital ($ per tonne) $7.6 $1.1 $1.1 $-$- $2.2 $-$ 2.5 $14.5 $ 1,320 $10.3 $1.5 $1.5 $-$3.7 $2.2 $0.9 $ 4.5 $24.6 $ 1,480 $15.2 $1.9 $2.2 $1.4 $3.7 $2.2 $0.9 $ 7.5 $35.0 $ 1,270 – Debt financing(5) – Pre-COD cash flows(6) Net equity $ (8.0) $ (2.5) $4.0 $(15.0) $ (3.6) $6.0 $ (20.0) $ (7.0) $8.0 2-Plant Case 3-Plant Case Full Development
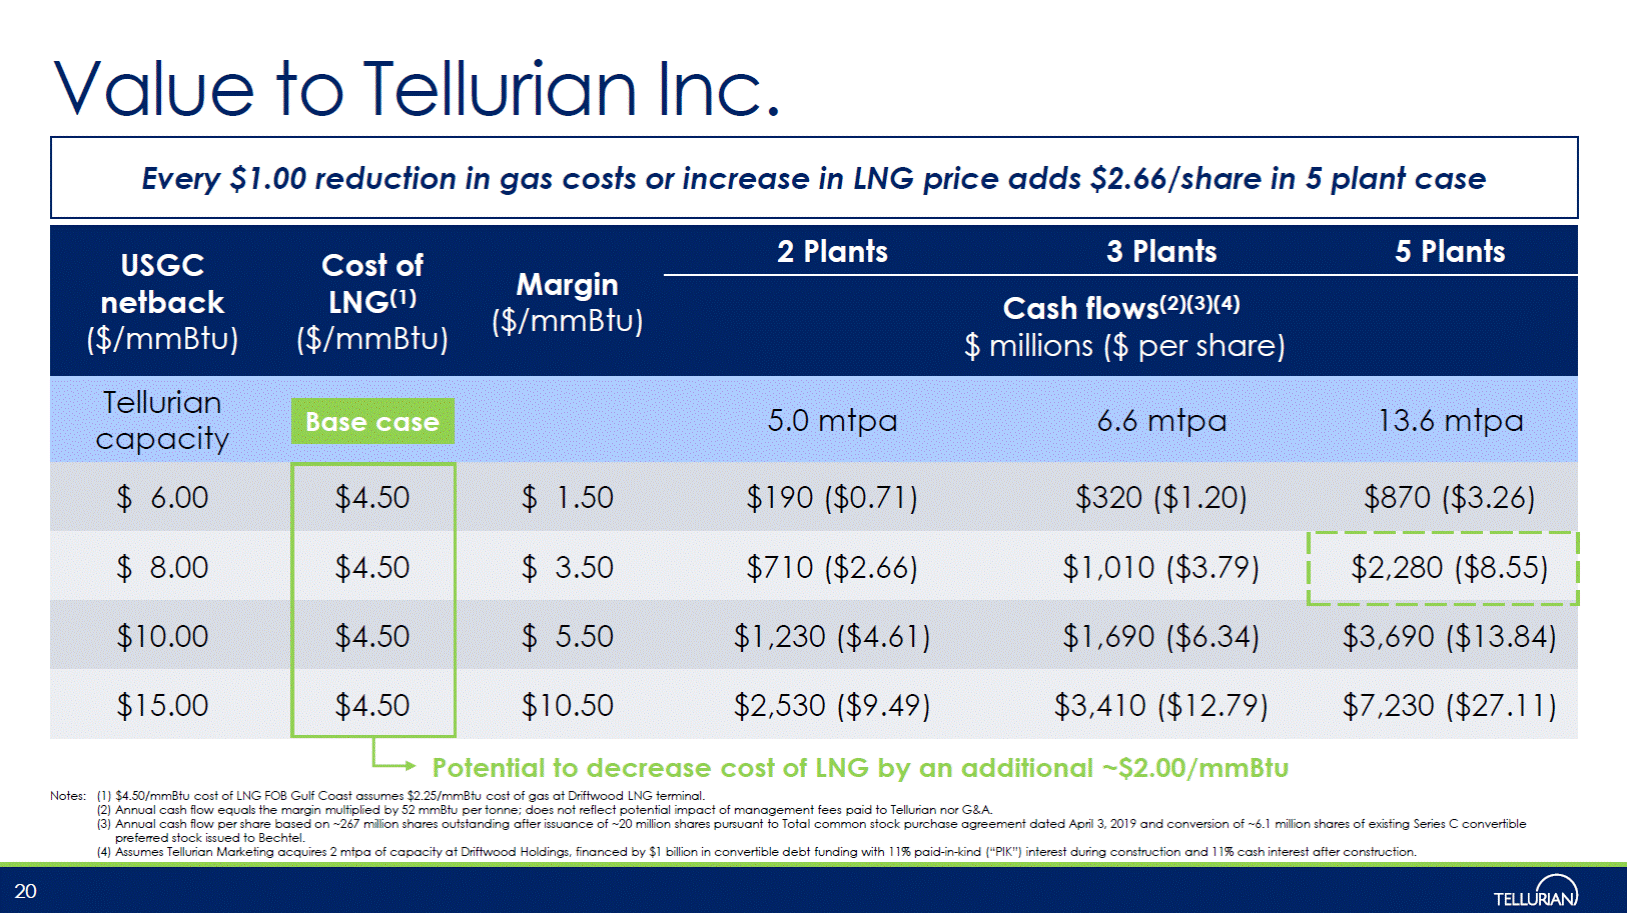
Value to Tellurian Inc. $ millions ($ per share) 5.0 mtpa 6.6 mtpa 13.6 mtpa capacity Potential to decrease cost of LNG by an additional ~$2.00/mmBtu Notes: (1) $4.50/mmBtu cost of LNG FOB Gulf Coast assumes $2.25/mmBtu cost of gas at Driftwood LNG terminal. (2) Annual cash flow equals the margin multiplied by 52 mmBtu per tonne; does not reflect potential impact of management fees paid to Tellurian nor G&A. (3) Annual cash flow per share based on ~267 million shares outstanding after issuance of ~20 million shares pursuant to Total common stock purchase agreement dated April 3, 2019 and conversion of ~6.1 million shares of existing Series C convertible preferred stock issued to Bechtel. (4) Assumes Tellurian Marketing acquires 2 mtpa of capacity at Driftwood Holdings, financed by $1 billion in convertible debt funding with 11% paid-in-kind (“PIK”) interest during construction and 11% cash interest after construction. 20 USGCCost of netbackLNG(1)Margin ($/mmBtu)($/mmBtu)($/mmBtu) 2 Plants3 Plants5 Plants Cash flows(2)(3)(4) Tellurian $6.00 $4.50 $1.50$190 ($0.71)$320 ($1.20)$870 ($3.26) $8.00 $4.50 $3.50$710 ($2.66)$1,010 ($3.79) $2,280 ($8.55) $10.00 $4.50 $5.50$1,230 ($4.61)$1,690 ($6.34)$3,690 ($13.84) $15.00 $4.50 $10.50$2,530 ($9.49)$3,410 ($12.79)$7,230 ($27.11) Base case Every $1.00 reduction in gas costs or increase in LNG price adds $2.66/share in 5 plant case
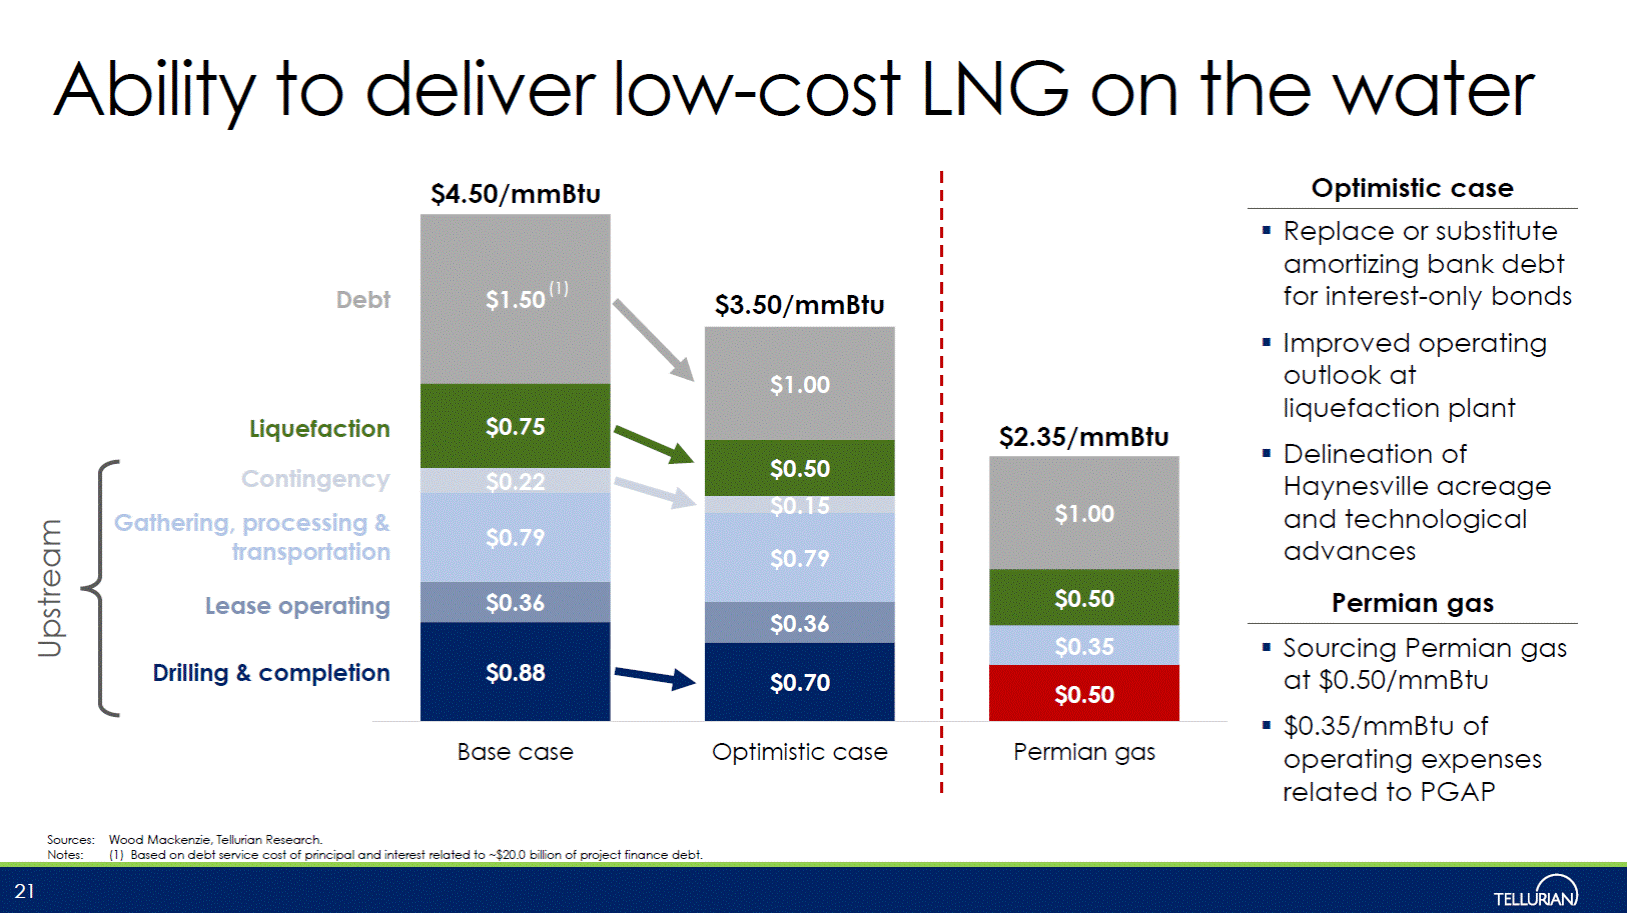
Ability to deliver low-cost LNG on the water Optimistic case Replace or substitute amortizing bank debt for interest-only bonds Improved operating outlook at liquefaction plant Delineation of Haynesville acreage and technological advances Permian gas Debt Liquefaction Contingency Gathering, processing transportation Lease operating Sourcing Permian gas at $0.50/mmBtu $0.35/mmBtu of operating expenses related to PGAP Drilling & completion Sources: Wood Mackenzie, Tellurian Research. Notes: (1) Based on debt service cost of principal and interest related to ~$20.0 billion of project finance debt. 21 Upstream $4.50/mmBtu $2.35/mmBtu & $1.50 (1) $3.50/mmBtu $1.00 $0.75 $0.50 $1.00 $0.22 $0.79 $0.79 $0.50 $0.36 $0.36 $0.35 $0.88 $0.70 $0.50 Base caseOptimistic case Permian gas
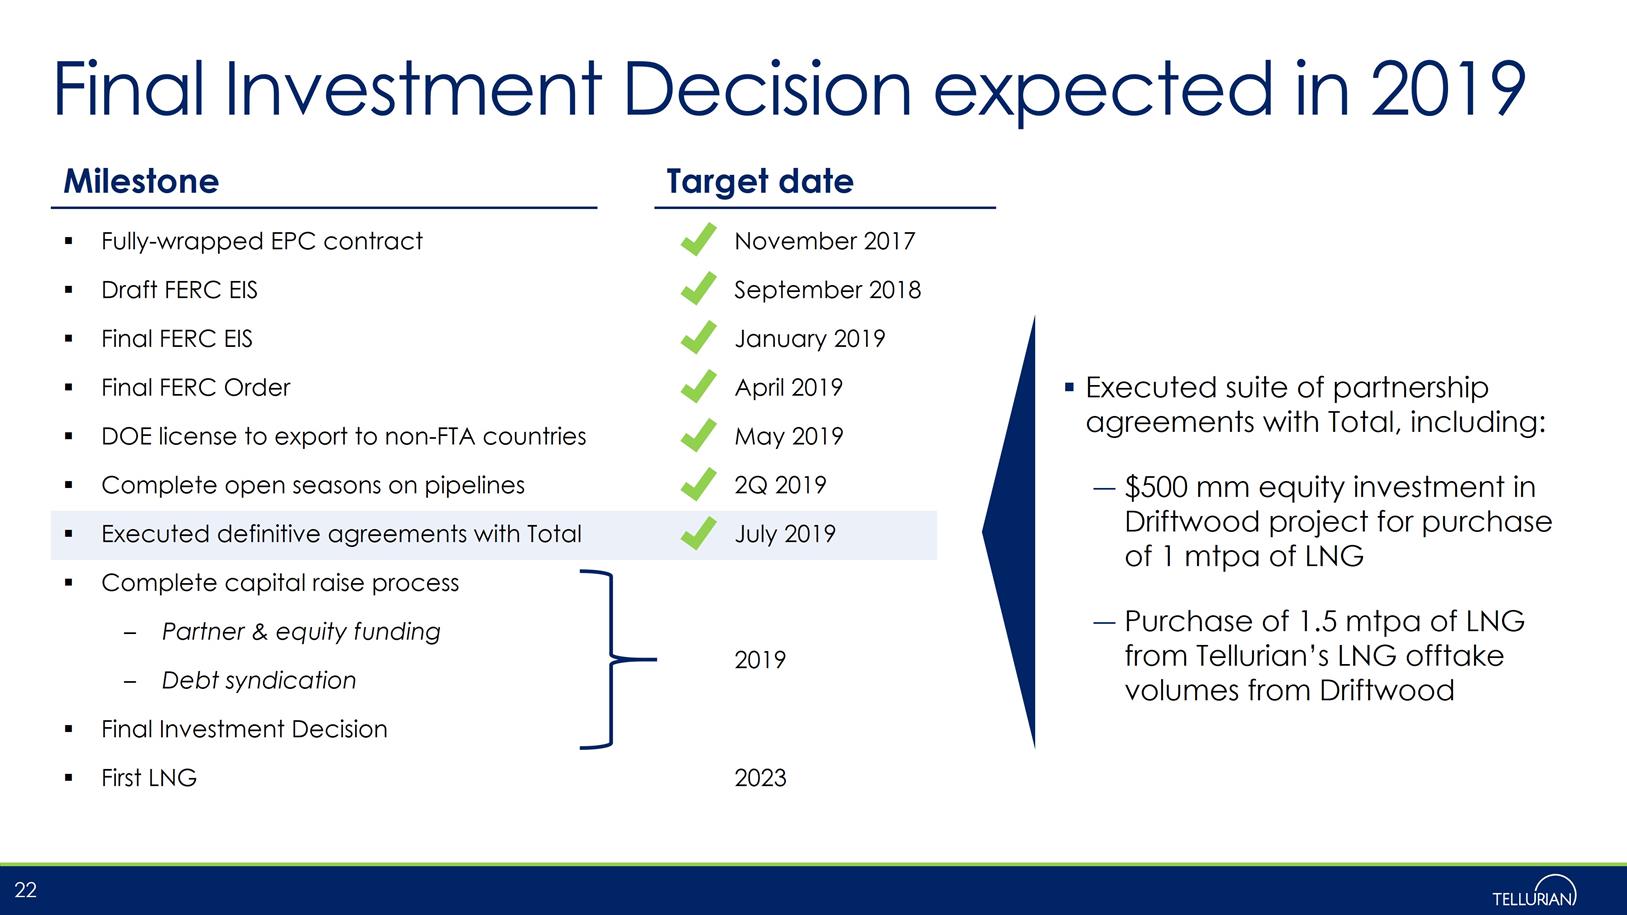
Final Investment Milestone Decision Target date expected in 2019 Fully-wrapped EPC contract Draft FERC EIS Final FERC EIS November 2017 September 2018 January 2019 Executed suite of partnership agreements with Total, including: Final FERC Order April 2019 DOE license to export to non-FTA countries May 2019 – $500 mm equity investment in Driftwood project for purchase of 1 mtpa of LNG Complete open seasons on pipelines 2Q 2019 Complete capital raise process – Purchase of 1.5 mtpa of LNG from Tellurian Marketing’s LNG offtake volumes from Driftwood LNG export terminal – Partner & equity funding 2019 – Debt syndication Final Investment Decision First LNG 2023 22 Executed definitive agreements with TotalJuly 2019
Contact us Amit Marwaha Director, Investor Relations & Finance +1 832 485 2004 amit.marwaha@tellurianinc.com Social media @TellurianLNG Joi Lecznar SVP, Public Affairs & Communication +1 832 962 4044 joi.lecznar@tellurianinc.com 23
Appendix 24

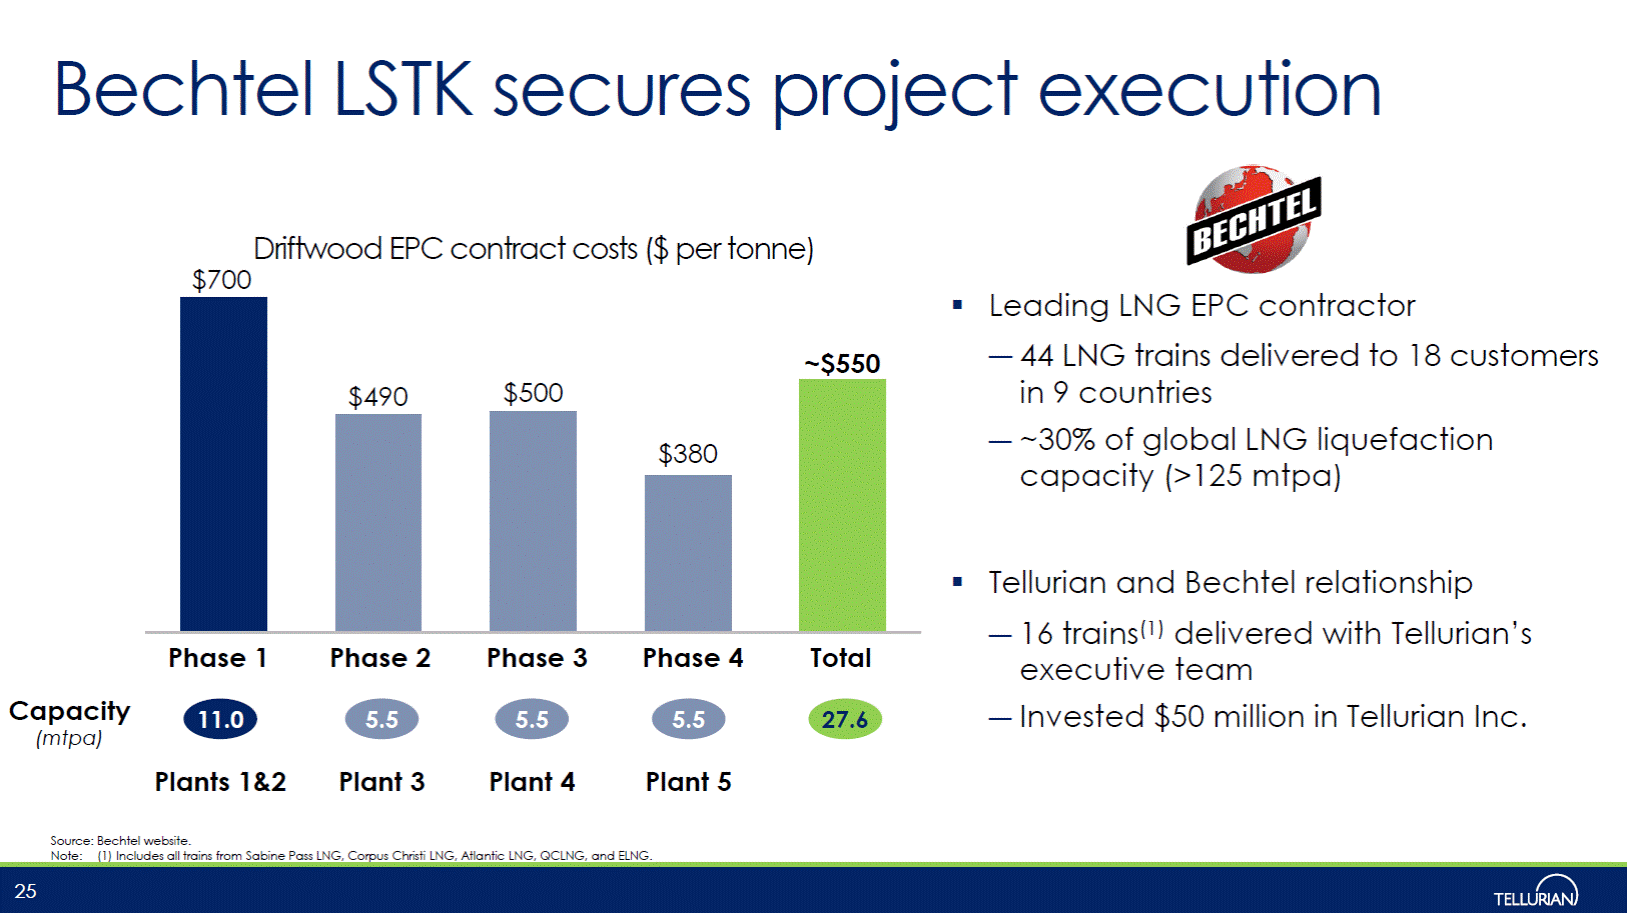
Bechtel LSTK secures project execution Driftwood EPC contract costs ($ per tonne) $700 Leading LNG EPC contractor – 44 LNG trains delivered to 18 customers in 9 countries – ~30% of global LNG liquefaction capacity (>125 mtpa) Tellurian and Bechtel relationship – 16 trains(1) delivered with Tellurian’s executive team – Invested $50 million in Tellurian Inc. Phase 1 Phase 2 Phase 3 Phase 4 Total Capacity (mtpa) 11.0 5.5 5.5 5.5 27.6 Plants 1&2 Plant 3 Plant 4 Plant 5 Source: Bechtel website. Note: (1) Includes all trains from Sabine Pass LNG, Corpus Christi LNG, Atlantic LNG, QCLNG, and ELNG. 25 ~$550 $490$500 $380
Driftwood Capacity, mtpa vs. competitors – cost per tonne 31.2 10.0 9.0 15.6 9.0 8.9 27.6 16.5 14.0 $5,025 Driftwood Qatar New Megatrain Mozambique Area 4 Yamal LNG Canada APLNG Gorgon Wheatstone Ichthys LPI global ranking(3): 4.0 3.6 2.7 2.6 3.9 3.8 3.8 3.8 3.8 Sources: Wood Mackenzie, The World Bank, Tellurian Research. Note: (1) Based on full development of Driftwood Holdings, inclusive of anticipated debt service cost. (2) LNG Canada’s cost per tonne is inclusive of TransCanada’s capex estimate for Coastal GasLink . (3) The World Bank bases the Logistics Performance Index (LPI) on surveys of operators to measure logistics “friendliness” in respective countries which is supplemented by quantitative data on the performance of components of the logistics chain. 26 $4,144 $3,774 $2,657 $2,214 $1,654 (2) $1,270(1)$1,428$1,603

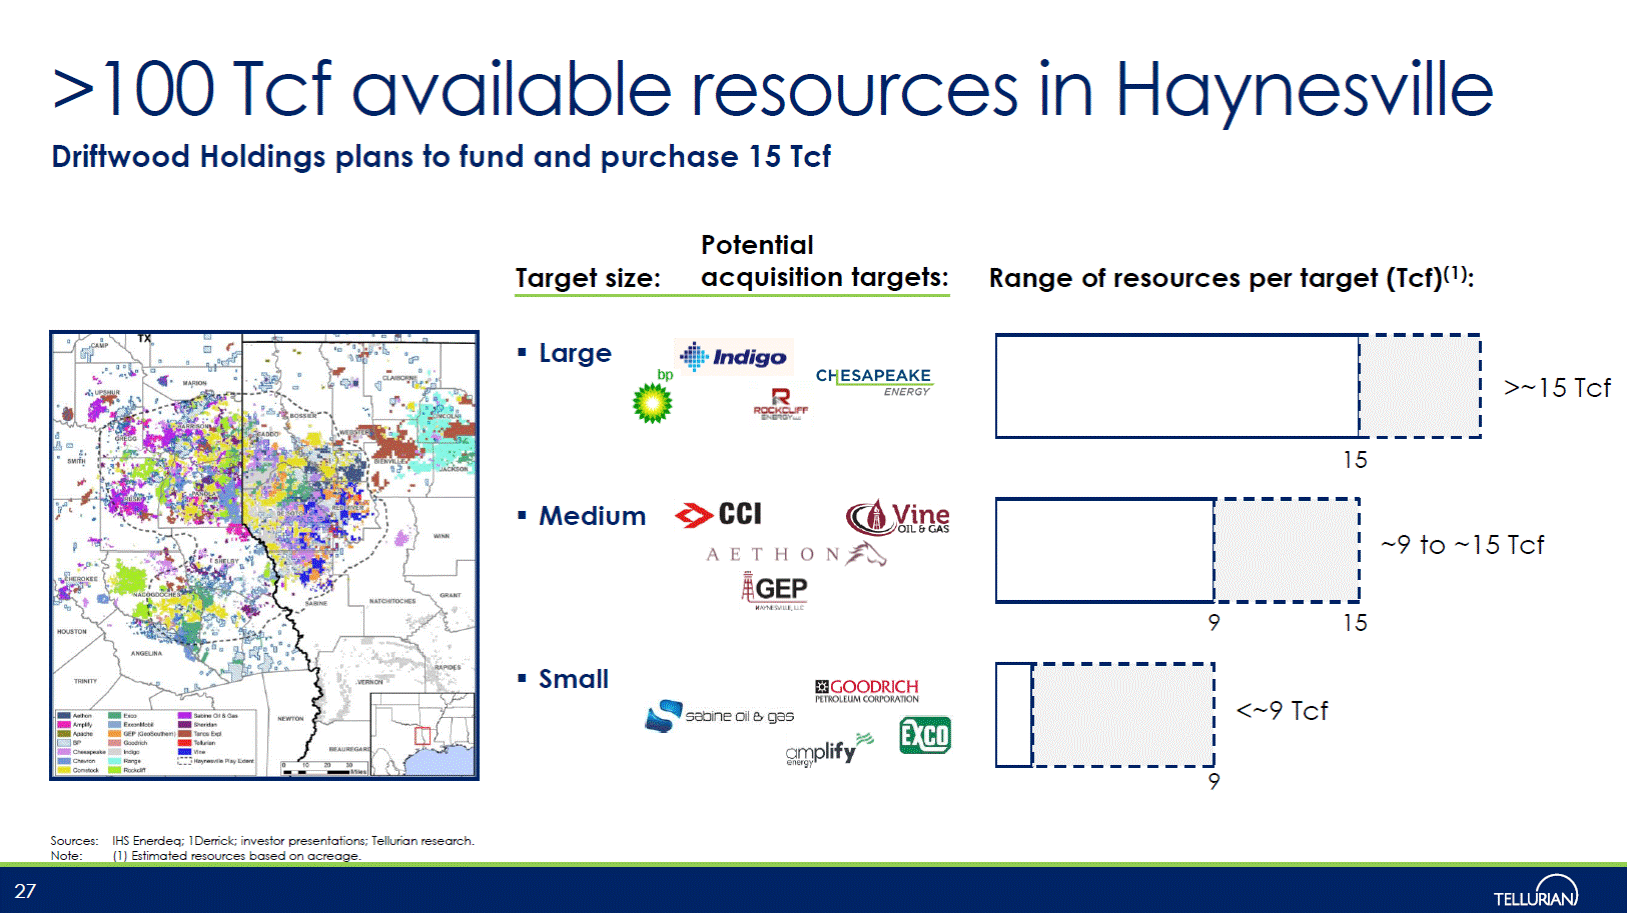
>100 Tcf available resources in Haynesville Driftwood Holdings plans to fund and purchase 15 Tcf Potential acquisition targets: Target size: Range of resources per target (Tcf)(1): Large >~15 Tcf 15 Medium ~9 to ~15 Tcf 9 15 Small <~9 Tcf 9 Sources: IHS Enerdeq; 1Derrick; investor presentations; Tellurian research. Note: (1) Estimated resources based on acreage. 27
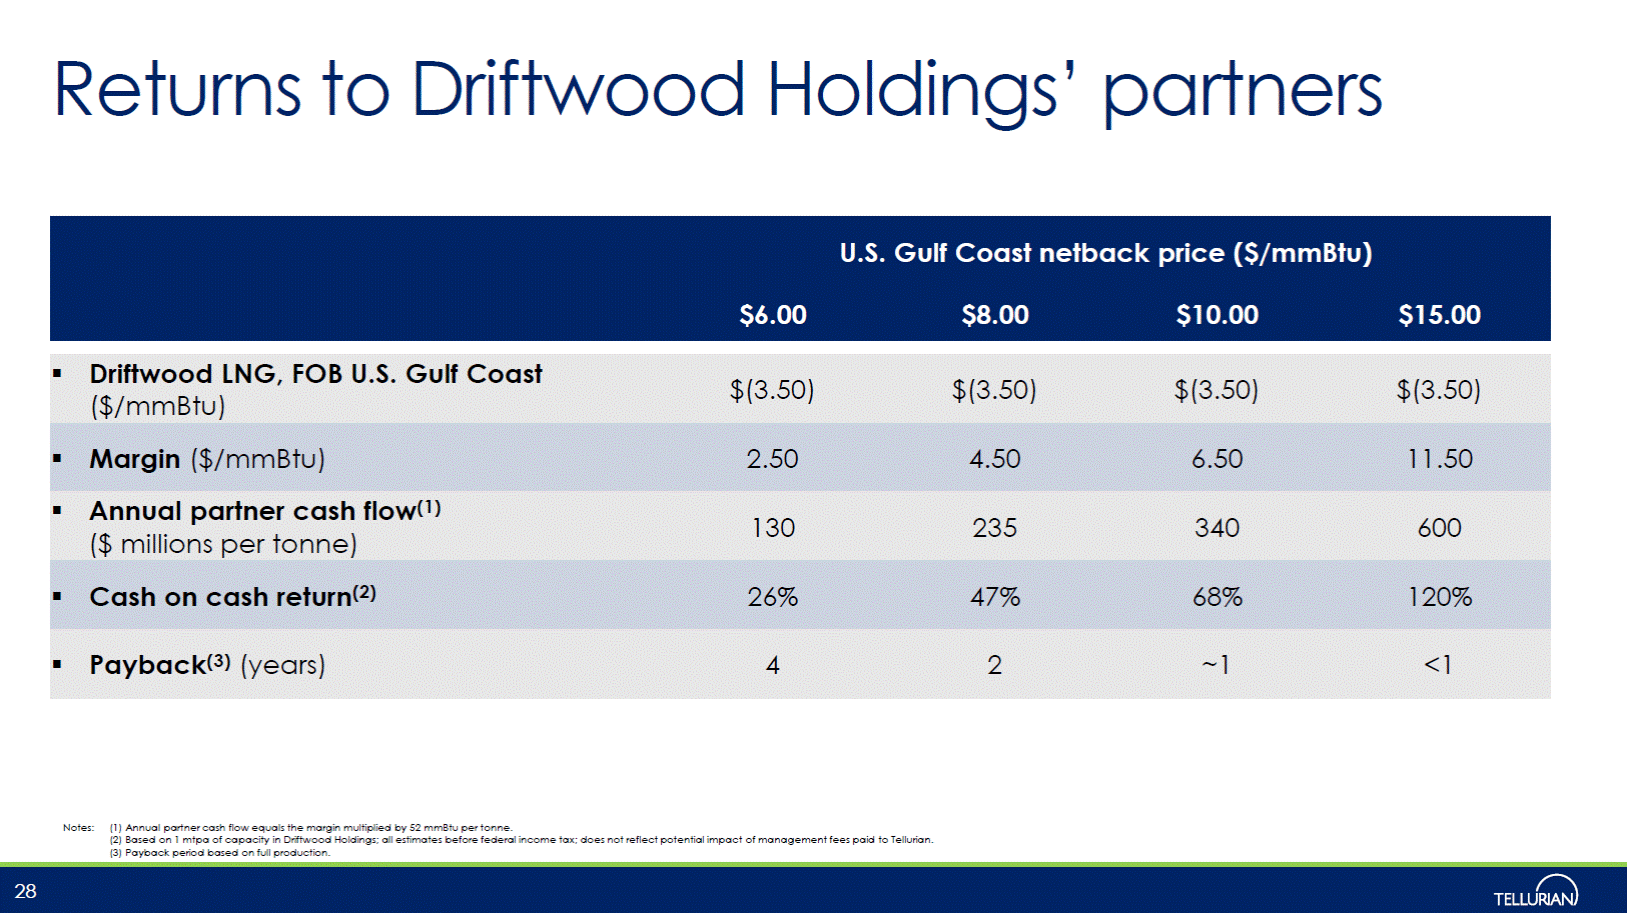
Returns to Driftwood Holdings’ partners $(3.50) $(3.50) $(3.50) $(3.50) ($/mmBtu) 130 235 340 600 ($ millions per tonne) Notes: (1) Annual partner cash flow equals the margin multiplied by 52 mmBtu per tonne. (2) Based on 1 mtpa of capacity in Driftwood Holdings; all estimates before federal income tax; does not reflect potential impact of management fees paid to Tellurian. (3) Payback period based on full production. 28 Driftwood LNG, FOB U.S. Gulf Coast Margin ($/mmBtu)2.504.506.5011.50 Annual partner cash flow(1) Cash on cash return(2)26%47%68%120% Payback(3) (years)42~1<1 U.S. Gulf Coast netback price ($/mmBtu) $6.00$8.00$10.00$15.00
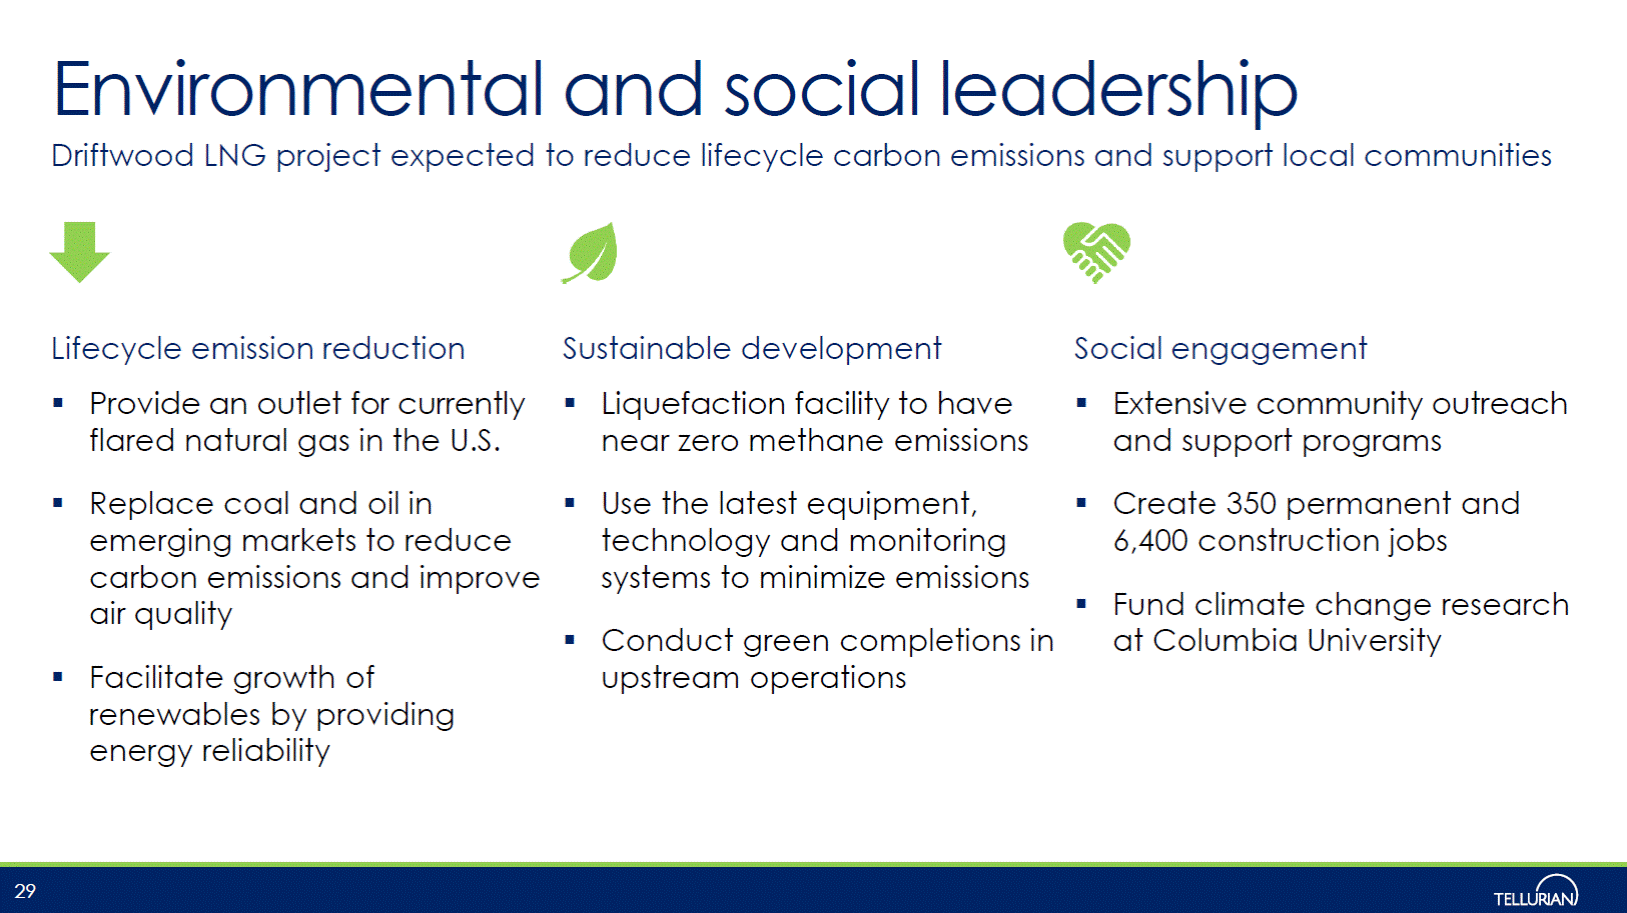
Environmental and social leadership Driftwood LNG project expected to reduce lifecycle carbon emissions and support local communities Lifecycle emission reduction Sustainable development Social engagement Provide an outlet for currently flared natural gas in the U.S. Liquefaction facility to have near zero methane emissions Extensive community outreach and support programs Replace coal and oil in emerging markets to reduce Use the latest equipment, technology and monitoring systems to minimize emissions Create 350 permanent and 6,400 construction jobs carbon emissions and air quality improve Fund climate change research at Columbia University Conduct green completions in upstream operations Facilitate growth of renewables by providing energy reliability 29
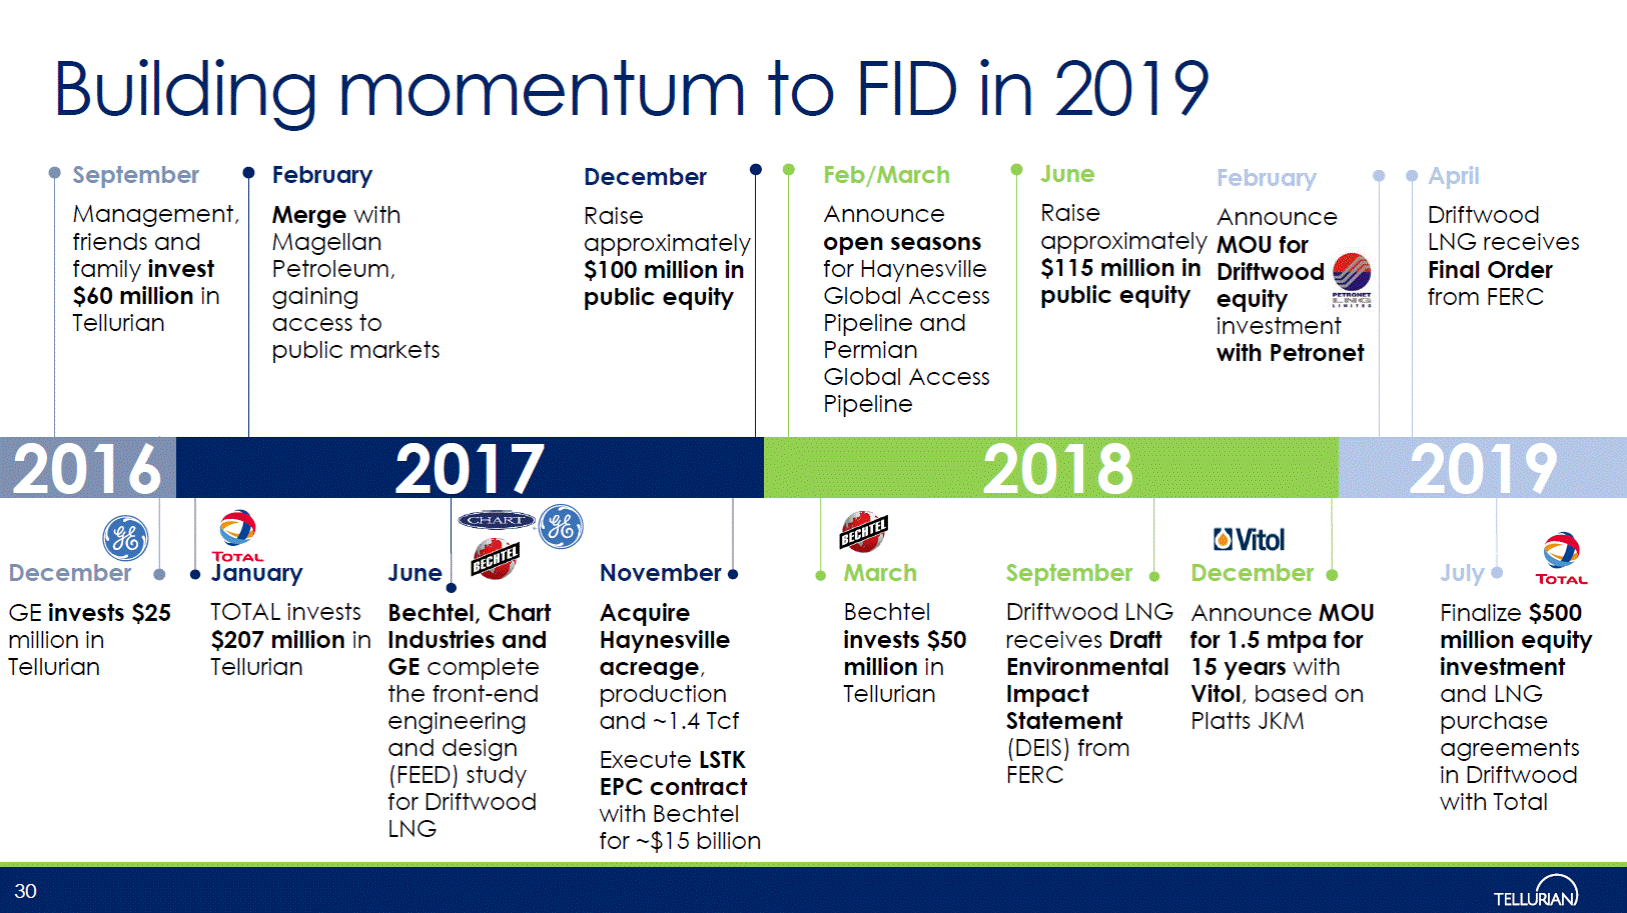
Building momentum to FID in 2019 June September February Feb/March April Driftwood LNG receives Final Order from FERC December February Management, friends and family invest $60 million in Tellurian et 2016 2019 December November March September December July GE invests $25 million in Tellurian TOTAL invests $207 million in Tellurian Bechtel, Chart Industries and GE complete the front-end engineering and design (FEED) study for Driftwood LNG Acquire Haynesville acreage, production and ~1.4 Tcf Execute LSTK EPC contract with Bechtel for ~$15 billion Bechtel invests $50 million in Tellurian Driftwood LNG receives Draft Environmental Impact Statement (DEIS) from FERC Announce MOU for 1.5 mtpa for 15 years with Vitol, based on Platts JKM Finalize $500 million equity investment and LNG purchase agreements in Driftwood with Total 30 Merge withRaise Magellanapproximately Petroleum,$100 million in gainingpublic equity access to public markets Announce open seasons for Haynesville Global Access Pipeline and Permian Global Access Pipeline RaiseAnnounce approximately MOU for $115 million in Driftwood public equityequity investment with Petron 2017 2018 JanuaryJune