UNITED STATES
SECURITIES AND EXCHANGE COMMISSION
Washington, D.C. 20549
Form 10-K
(Mark One)
þ ANNUAL REPORT PURSUANT TO SECTION 13 OR 15(d) OF THE SECURITIES EXCHANGE ACT OF 1934
For the fiscal year ended June 30, 2013, or
¨ TRANSITION REPORT PURSUANT TO SECTION 13 OR 15(d) OF THE SECURITIES EXCHANGE ACT OF 1934
for the transition period from to
Commission file number 001-5507
Magellan Petroleum Corporation
(Exact name of registrant as specified in its charter)
|
| | |
Delaware | | 06-0842255 |
(State or other jurisdiction of incorporation or organization) | | (I.R.S. Employer Identification No.) |
1775 Sherman Street, Suite 1950, Denver, CO | | 80203 |
(Address of principal executive offices) | | (Zip Code) |
Registrant’s telephone number, including area code: (720) 484-2400
Securities registered pursuant to Section 12(b) of the Act:
|
| | |
Title of Each Class | | Name of each exchange on which registered |
Common stock, par value $0.01 per share | | NASDAQ Capital Market |
Securities registered pursuant to Section 12(g) of the Act: None
Indicate by check mark if the registrant is a well-known seasoned issuer, as defined in Rule 405 of the Securities Act. Yes ¨ No þ
Indicate by check mark if the registrant is not required to file reports pursuant to Section 13 or Section 15(d) of the Act. Yes ¨ No þ
Indicate by check mark whether the registrant (1) has filed all reports required to be filed by Section 13 or 15(d) of the Securities Exchange Act of 1934 during the preceding 12 months (or for such shorter period that the registrant was required to file such reports), and (2) has been subject to such filing requirements for the past 90 days. Yes þ No ¨
Indicate by check mark whether the registrant has submitted electronically and posted on its corporate Web site, if any, every Interactive Data File required to be submitted and posted pursuant to Rule 405 of Regulation S-T (§ 232.405 of this chapter) during the preceding 12 months (or for such shorter period that the registrant was required to submit and post such files). Yes þ No ¨
Indicate by check mark if disclosure of delinquent filers pursuant to Item 405 of Regulation S-K (§ 229.405 of this chapter) is not contained herein, and will not be contained, to the best of registrant’s knowledge, in definitive proxy or information statements incorporated by reference in Part III of this Form 10-K or any amendment to this Form 10-K. ¨
Indicate by check mark whether the registrant is a large accelerated filer, an accelerated filer, a non-accelerated filer, or a smaller reporting company. See the definitions of "large accelerated filer," "accelerated filer" and "smaller reporting company" in Rule 12b-2 of the Exchange Act.:
|
| | | | | | |
Large accelerated filer o | | Accelerated filer o | | Non-accelerated filer o | | Smaller reporting company þ |
| | | | (Do not check if a smaller reporting company) | | |
Indicate by check mark whether the registrant is a shell company (as defined in Rule 12b-2 of the Exchange Act). Yes ¨ No þ
The aggregate market value of the common equity held by non-affiliates of the registrant, based on the $0.922 closing price per share of the registrant's common stock as reported by the NASDAQ Capital Market, as of December 31, 2012 (the last business day of the most recently completed second fiscal quarter) was $33,470,909. For the purpose of this calculation, shares of common stock held by each director and executive officer and by each person who owns ten percent or more of the outstanding shares of common stock or who is otherwise believed by the registrant to be in a control position have been excluded. This determination of affiliate status is not necessarily a conclusive determination for any other purpose.
Indicate the number of shares outstanding of each of the registrant’s classes of common stock, as of the latest practicable date:
Common stock, par value $0.01 per share, 45,359,647 shares outstanding as of September 12, 2013.
DOCUMENTS INCORPORATED BY REFERENCE
Portions of the definitive proxy statement related to the 2013 annual meeting of stockholders to be filed within 120 days after June 30, 2013, are incorporated by reference in Part III of this Form 10-K to the extent stated herein.
TABLE OF CONTENTS
PART I
ITEMS 1 AND 2: BUSINESS AND PROPERTIES
GENERAL
Magellan Petroleum Corporation (the "Company" or "Magellan" or "we" or "us") is an independent energy company engaged in the exploration, development, production, and sale of crude oil and natural gas. The Company conducts its operations through three wholly owned subsidiaries: Nautilus Poplar LLC ("NP"), which owns and operates an oil field covering Poplar Dome ("Poplar") located in the Williston Basin in eastern Montana; Magellan Petroleum Australia Pty Ltd ("MPA"), which owns and operates onshore gas fields in Australia, and owns an offshore exploration license in Australia; and Magellan Petroleum (UK) Limited ("MPUK"), which owns a large acreage position in the Weald and Wessex Basins in southern England prospective for conventional and unconventional oil and gas production.
Magellan was founded in 1957 and incorporated in Delaware in 1967. The Company's common stock has been trading on the NASDAQ since 1972 under the ticker symbol "MPET."
Our principal offices are located at 1775 Sherman Street, Suite 1950, Denver, Colorado, 80203, and our telephone number is (720) 484-2400.
STRATEGY
Our strategy is to enhance shareholder value by maximizing the value of our existing assets. Our portfolio of operations includes several early stage oil and gas exploration and development projects, the successful development of which requires significant capital, as well as significant engineering and management resources. We are committed to investing in these projects to establish their technical and economic viability. In turn, we are focused on determining the most efficient way to create greatest value and highest returns for our shareholders.
SIGNIFICANT DEVELOPMENTS IN FISCAL YEAR 2013
During fiscal year 2013, the Company took important steps in its strategy of creating value from our existing assets. Administratively, we completed the two-year turn-around of the Magellan platform through a number of achievements, including: hiring new engineering and geologic personnel, completing the overhaul of our accounting function, voluntarily delisting from the Australian Securities Exchange ("ASX"), repurchasing 17% of our common shares plus warrants that had been pledged by an entity affiliated with a former director, and raising $23.5 million through the issue of convertible preferred equity on attractive terms. As a result, we believe we now have an organized and effective platform poised to achieve growth and the successful development of our assets.
Operationally, we made steady progress on each of our key projects such that we can continue to achieve key developmental and operational milestones in fiscal year 2014. At Poplar, our work on the CO2-enhanced oil recovery ("CO2-EOR") pilot project during fiscal year 2013 resulted in obtaining a CO2 supply contract and receiving the permits to start the drilling of our pilot wells in July and August 2013, respectively. With the drilling of CO2-EOR pilot wells now underway, we expect to be able to deliver results by the end of calendar year 2014. In parallel, we initiated a water shut-off program to increase oil production from the existing wells at Poplar and reduce our operating costs. This program has started to yield positive results, and we will continue to roll it out across the field as we gather results from each treatment. Onshore Australia, we spent most of fiscal year 2013 in discussions and contract negotiations with potential customers of gas from our properties in the Dingo field, resulting in the signing of a long term gas supply and purchase agreement (the "Dingo GSPA") with Northern Territory Power and Water Corporation ("PWC") for the sale over a 20-year period of the majority of our current estimated probable reserves at Dingo. Gas sales are expected to commence in early calendar year 2015 once surface facilities and a tie-in pipeline are constructed at Dingo. With gas sales contracts in place at both Palm Valley and Dingo, and considering the cost of Dingo's surface facilities and pipeline tie-in, we expect our Amadeus Basin assets to provide Magellan with reasonably predictable cash flows. Offshore Australia, we conducted 2-D and 3-D seismic surveys over portions of NT/P82, our 100% owned exploration license in the Bonaparte Basin. Based on the preliminary interpretation of the seismic data we acquired, we believe we can successfully execute a farmout transaction in fiscal year 2014 whereby a new partner will drill the large gas prospects that lie within our block. In the UK, together with our partner Celtique Energie Holdings Ltd ("Celtique"), we completed an extensive geological analysis of the potential prospects underlying our Weald Basin acreage. In addition, we prepared and filed applications for permits to drill exploratory wells on our acreage, which will allow us to drill and further assess the potential for conventional and unconventional oil and gas production in fiscal year 2014.
As a result of the achievements and improvements realized in fiscal year 2013, in fiscal year 2014 we expect to progress various operational initiatives to points that will permit us to demonstrate the potential value of our assets and develop an asset rationalization strategy to maximize Magellan's net asset value per share.
Financial Performance
Our 2013 fiscal year financial results were significantly affected by the full-year impact of events in Australia that occurred during fiscal year 2012, namely the termination of the 25-year gas sales contract between Palm Valley and PWC (the "PWC Palm Valley Contract") in January 2012 and completion of the asset swap with Santos QNT Pty Ltd ("Santos QNT") and Santos Limited (collectively "Santos") in May 2012 (the "Santos SA"). These events together resulted in a significant decline in revenue and net income. Adjusted EBITDAX, however, improved slightly as reduced expenditures offset the loss of revenue.
We expect fiscal year 2013 to be a "trough" year in terms of revenues and earnings, with greater hydrocarbon production expected from our operating assets in fiscal years 2014 and 2015. At Poplar, the results of ongoing work-overs and water shut-off treatments, as well as production from the CO2-EOR pilot project, are expected to increase production from Poplar over the next twelve months. Gas reserves at Palm Valley are currently contracted to Santos through the Palm Valley GSPA (as defined below), and gas sales volumes are expected to increase under this contract to an annualized rate of 1.3 Bcf by the end of fiscal year 2014 and 1.5 Bcf by the end of fiscal year 2015. In addition, in September 2013, the Company signed the Dingo GSPA, a long term, inflation-indexed contract with PWC, for the sale of Dingo gas reserves, under which gas sales are expected to commence in early calendar year 2015.
Revenues. For the fiscal year ended June 30, 2013, revenues totaled $7.1 million compared to $13.7 million in the prior year, a decrease of 48%. This decrease was primarily the result of the termination of the PWC Palm Valley Contract in January 2012 and the sale of Magellan's interests in the Mereenie oil and gas field to Santos in May 2012 as part of the Santos SA.
Under Palm Valley's current gas supply and purchase agreement with Santos (the "Palm Valley GSPA"), gas sales volumes and revenues are currently expected to increase materially in the second half of fiscal year 2014. Under the terms of the Dingo GSPA signed in September 2013, new gas sales volumes and revenues from Dingo are expected to commence in early calendar year 2015.
Net Income and Earnings per Share. For the fiscal year ended June 30, 2013, net loss was $19.8 million ($(0.41)/basic share), compared to net income of $26.5 million ($0.49/basic share) for the prior fiscal year. The decrease in net income was primarily the result of non-recurring gains on sales of assets of $40.4 million recorded in fiscal year 2012 related to the Santos SA in May 2012, and the farmout of an interest in Poplar to VAALCO in September 2011 (the "VAALCO Farmout").
Adjusted EBITDAX. For the fiscal year ended June 30, 2013, Adjusted EBITDAX (see Non-GAAP Financial Measures and Reconciliation under Part I, Items 1 and 2: Business and Properties) was negative $10.9 million, compared to negative $11.2 million in the prior fiscal year, a positive change of 2%. The slight improvement in Adjusted EBITDAX resulted from a decrease in revenues offset by a corresponding decrease in lease operating expense, both primarily due to the sale of the Company's interest in Mereenie in May 2012 as part of the Santos SA and a decrease in general and administrative expense.
Cash. As of June 30, 2013, Magellan had $32.5 million in cash and cash equivalents as compared to $41.2 million at the end of the prior fiscal year. The decrease of $8.7 million was primarily the result of investment in work-overs and water shut-off treatments at Poplar, the cost of the 2-D and 3-D seismic surveys over NT/P82 (as defined below), our offshore block in Australia, and the repurchase of shares and warrants from Sopak AG (as defined below) in January 2013. These cash outflows were partially offset by $23.0 million in net proceeds from the issuance of convertible preferred stock in May 2013. We believe that our cash balance will permit us to determine the most efficient way to enhance shareholder value through assessing the potential value of our existing assets.
Operational Progress on Our Key Projects
In fiscal year 2013, management diligently pursued its strategy of proving up the value of the Company's existing assets as the most economic way of increasing shareholder value. Towards that end, management made steady progress on the development of all our key projects and has laid the groundwork for the achievement of key milestones in fiscal year 2014.
CO2-EOR at Poplar. On the basis of reservoir modeling and lab testing performed in the prior year, in fiscal year 2013, management focused heavily on furthering plans for a CO2-EOR program in the Charles formation at Poplar. In particular, the Company prepared for a five-well CO2-EOR pilot project planned for fiscal year 2014. Specifically, the Company worked to fulfill the various regulatory requirements necessary to obtain permits to drill the pilot wells. These permits were obtained in August 2013. In addition, the Company held extensive discussions with various CO2 suppliers. These efforts led to a two-year CO2 supply contract with Air Liquide Industrial U.S. LP ("Air Liquide") in July 2013. Air Liquide is the world leader in gases
for industry, health, and the environment. The Company also began dialogues with large-scale CO2 producers regarding the long term supply of CO2 for a full field CO2-EOR program at Poplar, which would follow the completion of the CO2-EOR pilot project if it proves successful.
NT/P82. During fiscal year 2013, Magellan focused on conducting a seismic survey over portions of its NT/P82 Exploration Permit ("NT/P82") in the Bonaparte Basin, offshore Northern Territory, Australia. In December 2012, the Company successfully conducted, via a third-party contractor, a 2-D and 3-D seismic survey over portions of the block. The seismic recording vessel Voyager Explorer, operated by Seabird Exploration FZ-LLC, acquired a total of 76 square miles of 3-D full fold data and 65 miles of 2-D full fold data. Between January and August 2013, the seismic data was undergoing processing and interpretation, the results of which were received in August 2013. We believe that the results of the seismic survey will allow the Company to begin a farmout process during the second quarter of fiscal year 2014. Through this process, the Company expects to identify a partner to drill exploratory wells over the large gas prospects that lie in our permit area in exchange for an ownership interest in and operatorship of the license.
Dingo. In fiscal year 2013, the Company undertook marketing efforts to identify and attract long term customers for Dingo's gas resources. These efforts resulted in the signing of the Dingo GSPA with PWC in September 2013 for the supply of up to 31 petajoules ("PJ") (30 billion cubic feet ("Bcf")) of gas over a 20-year period at a fixed price escalating with Australian CPI. In parallel to the marketing efforts, during the fiscal year Magellan completed a pre-front-end engineering and design ("pre-FEED") study to evaluate the cost and logistics of installing gas treatment facilities and laying a pipeline to tie the Dingo field into the existing pipeline infrastructure at Brewer Estate, south of Alice Springs, where PWC will take delivery of the gas. This study will serve as the basis for bringing Dingo to operational capability at the beginning of calendar year 2015.
United Kingdom. In fiscal year 2013, Magellan focused primarily on carrying out extensive geological analysis and planning for the exploration of three of the Production Exploration and Development Licenses ("PEDLs") it co-owns 50% with its partner Celtique (PEDLs 231, 234, and 243) in the Weald Basin in southern England. These licenses are prospective for unconventional oil production from the Kimmeridge Clay and Liassic formations. The Company, in conjunction with Celtique, which operates the licenses, worked toward permitting well site locations and evaluating the prospects for drilling exploratory wells, the first of which the Company expects to spud in the third quarter of fiscal year 2014.
Also in fiscal year 2013, it appears that the macro environment in the UK underwent favorable developments that positively impact the outlook on the development of unconventional resources. In December 2012, the UK government announced that exploratory hydraulic fracturing activities could resume in the UK following a moratorium on the practice. In February 2013, the government also announced plans to better exploit its unconventional hydrocarbon resources. Tax incentives and other favorable changes in UK laws and regulations with respect to onshore drilling in the UK are expected to be introduced in the coming months.
Realignment of Shareholder Base and Preferred Equity Issuance
During fiscal year 2013, the Company effected two major changes in its shareholder base. In January 2013, it repurchased 17% of its common stock and related warrants representing up to an incremental 7% dilution overhang from Sopak AG, a Swiss subsidiary of Glencore International plc ("Sopak"), which aquired the stock and warrants through a pledge by an entity affiliated with a former director. Later in the fiscal year, the Company issued convertible preferred stock to a new single investor, thereby replenishing its cash balances and gaining a new long term strategic and financial partner.
Series A Convertible Preferred Stock Financing Agreement with One Stone. On May 10, 2013, the Company entered into a Series A Convertible Preferred Stock Purchase Agreement (the "Series A Purchase Agreement") with an affiliate of One Stone Energy Partners, L.P., a New York based private equity firm focused on investments in the oil and gas industry (both the private equity firm and its affiliate are hereinafter referred to collectively as "One Stone"). Pursuant to the terms of the Series A Purchase Agreement, on the closing date of May 17, 2013, the Company issued and sold to One Stone 19,239,734 shares of Series A Convertible Preferred Stock, par value $0.01 per share (the "Series A Preferred Stock"), at a purchase price of $1.22149381 per share, for aggregate net proceeds of approximately $23.0 million. Each share of Series A Preferred Stock will be entitled to a dividend equivalent to 7.0% per annum. Subject to certain conditions, each share of Series A Preferred Stock and any related unpaid accumulated dividends will be convertible into one share of the Company's common stock at an initial conversion price of $1.22149381 per share.
Management believes that this Series A Preferred Stock financing was a critical milestone in the path to delivering value to shareholders because the proceeds of this transaction, together with the proceeds from potential asset sales or farmout arrangements, in addition to the Company's existing cash resources, will provide the Company with sufficient liquid capital resources to fund (i) the CO2-EOR pilot project at Poplar, including the purchase of necessary CO2 volumes; (ii) the current negative cash flow from operations, which is expected to be partially mitigated by the planned ramp up of gas sales from our onshore Australian assets in calendar year 2014; and (iii) the Company's efforts to further establish the value of our UK acreage
through the participation in one or more exploratory wells in calendar year 2014.
In pursuing this financing, the Company considered a number of alternatives, including equity issuances via a PIPE or secondary offering to the institutional investor markets, conventional bank debt, and mezzanine loans from a bank and alternative investment markets. The Company also considered the sale of non-core assets, but determined that this alternative would have been premature at the time, as the UK acreage remained highly prospective, 3-D seismic data over NT/P82 was still undergoing processing and interpretation, and the onshore Australian assets were not yet fully contracted.
Ultimately, the Company determined this Series A Preferred Stock financing to be the most attractive financing option available. Through this financing, the Company (i) gained a long term strategic and financial partner in One Stone; (ii) received approximately $23.0 million in net proceeds convertible at a 20% premium to the common share price prior to the transaction, without issuing any warrants; and (iii) maintained certain protections in the form of forced conversion and redemption rights. Management believes that, in spite of potential ownership dilution to existing shareholders, this transaction represented the most timely and efficient path to increasing net asset value per share.
The Series A Purchase Agreement and the related Certificate of Designations of the Series A Preferred Stock and Registration Rights Agreement have been previously filed as exhibits to the Company's US Securities and Exchange Commission ("SEC") reports, and are incorporated by reference in the exhibits under Part IV, Item 15 of this report. For a more detailed summary of the key terms of the Series A Purchase Agreement, please see Note 8 to the consolidated financial statements included in Item 8: Financial Statements and Supplementary Data of this report.
Sopak, YEP, and Nikolay V. Bogachev; Share and Warrant Repurchases. On January 14, 2013, the Company entered into a Collateral Purchase Agreement with Sopak. Under the terms of this agreement, Magellan paid $10.0 million to Sopak for 9,264,637 shares of Magellan common stock, a warrant granting Sopak the right to purchase an additional 4,347,826 shares of Magellan common stock at an exercise price of $1.15 per share, and a registration rights agreement related to the repurchased shares and warrant. In addition, the Company obtained from both Nikolay V. Bogachev, who served as a director of the Company until his resignation effective January 16, 2013, and Young Energy Prize S.A. ("YEP"), a Luxembourg entity affiliated with Mr. Bogachev, a release from all claims by those parties against Magellan or its assets. Sopak originally obtained its shares and warrant in September 2012 by exercising its rights under a pledge and security agreement between Sopak and YEP.
As a result of this transaction, the Company repurchased 17% of its outstanding common stock and eliminated the significant potential dilutive impact of the related warrant at a price and at a time that the Company believes was attractive.
For further details on this transaction, see Note 9 to the consolidated financial statements included in Item 8: Financial Statements and Supplementary Data of this report.
OUTLOOK FOR FISCAL YEAR 2014
During fiscal year 2014, Magellan intends to execute on its strategy of proving the potential of its existing assets. We are particularly focused on the four projects below, which we intend to fund through the Company's cash resources comprised of cash on hand and proceeds from asset sales or farmout arrangements, which include the proceeds from the Series A Preferred Stock issuance in May 2013:
| |
• | implementing a CO2-EOR pilot project at Poplar; |
| |
• | drilling one and possibly two wells in the UK to evaluate the potential of the various formations in our licenses in the UK; |
| |
• | contracting most of Dingo's gas reserves under a long term agreement, which was achieved in September 2013 through the Dingo GSPA and conducting the engineering, design, and construction of the pipeline and surface facilities to make Dingo ready for gas production in fiscal year 2015; |
| |
• | completing the processing and interpretation of seismic data for NT/P82 and identifying a farm-in partner to drill one or more exploration wells on the exploration permit in Australia in fiscal year 2015. |
Management believes that each of these projects has significant potential that, if realized, could materially impact the Company's reserves and the underlying net asset value per share and eventually allow the Company to generate positive cash flow from operations. Specific steps and milestones for each of these key areas are discussed below. By pursuing these courses of action in parallel, management expects that, over the next 12 to 15 months, the Company will be able to validate the value potential of these assets and will be able to determine the most appropriate course of action with respect to each asset to achieve the best value for its shareholders.
CO2-EOR Pilot Project
In fiscal year 2014, the Company intends to implement a CO2-EOR pilot project in the Charles formation at Poplar to validate the reserves potential of this tertiary recovery technique on a full-field basis. In July 2013, the Company signed an approximately two-year CO2 supply contract with Air Liquide for the CO2 necessary to complete the CO2-EOR pilot project. In August 2013, the Company obtained permits from the US Bureau of Land Management to drill the five wells necessary for the pilot project. Drilling began in August 2013 and is expected to continue through November of this year. Currently we plan for the five pilot wells to be arranged in a "five-spot" pattern, with a single CO2 injection well in the center surrounded by four producing wells. CO2 injection is expected to commence in October 2013. From the time of first injection, it will take between 12 and 15 months to evaluate the effectiveness of the CO2-EOR technique and announce results from the pilot project. The cash cost of the pilot project, including capital and certain operating expenditures including the cost of the supply of CO2 over two years, will total approximately $20.0 million, with most of these expenditures incurred by March 2014.
With the results of the CO2-EOR pilot project expected to be received by the end of calendar year 2014, the Company hopes to demonstrate that the implementation of a full-field CO2-EOR program at Poplar could result in the recovery of approximately an additional 50 million barrels of oil. Based on our own work, the production history of the field to date, and reference to analogous CO2-EOR projects in the Williston Basin, management believes that the Charles formation at Poplar has 500 to 600 million barrels of oil in place and the recovery of an incremental 10% of this amount is an achievable objective.
United Kingdom Exploration Wells
In fiscal year 2014, the Company will focus on evaluating the potential of its conventional and unconventional prospects in the Weald Basin in southern England, which are primarily contained within the license areas of PEDLs 231, 234, and 243, which the Company co-owns 50% with Celtique. These licenses are prospective for unconventional oil production. The PEDLs are due to expire at the end of June 2014 and are subject to customary "drill or drop" work commitment and a 50% relinquishment rule. These PEDLs will be extended for an additional 5-year period if work commitments are met. We and our partner, Celtique, are planning to drill the first exploration well in PEDL 234, the location of which may meet our work commitments for both PEDLs 234 and 243. We expect to spud this well in the third quarter of fiscal year 2014. In addition, we are in the process of permitting a well in PEDL 231 to fulfill our commitments for this lease area, and will apply for a 12-month extension to our current PEDL to allow additional time to receive planning approval. In PEDL 234, we are also awaiting final planning approval to drill a well in the center of the Basin, which may spud in the fourth quarter of fiscal year 2014. The purpose of these wells is to test and evaluate the Kimmeridge Clay and Liassic formations in order to substantiate the unconventional oil and gas production potential of our acreage and to test and evaluate the conventional prospects in the Triassic formation. Under the terms of our joint operating agreement with Celtique, we are required to participate in these commitment wells to maintain our working interest in the PEDLs. We intend to participate in the drilling of these wells and expect to fund our share of the costs through either our cash reserves, the farmout of a portion of our interests, or the proceeds from other asset sales.
With regards to PEDL 137, of which the Company owns 100%, we expect to finalize the terms of a farmout agreement with a partner to drill the Horse Hill prospect, which targets Jurassic and Triassic formations with oil and gas potential, respectively. With regards to the various PEDLs (PEDLs 126, 155, 240, 256, and P1916) the Company owns along with Northern Petroleum Plc ("Northern"), we do not anticipate any significant activity in fiscal year 2014.
Dingo Development
In September 2013, the Company signed the Dingo GSPA with PWC for the sale of up to 31 PJ (30 Bcf) of gas over a 20-year period to PWC, commencing early in calendar year 2015. With a long term contract now in place, the Company will use the intervening time period to design, construct, and commission the surface facilities and tie-in pipeline necessary for the production and delivery of Dingo's gas. Gas volumes are expected to be produced from three wells drilled at Dingo in the 1980s and 1990s, of which two wells have since been temporarily shut-in but are expected to be capable of producing gas volumes sufficient to meet the initial delivery requirements under the Dingo GSPA. Currently, the Company is undertaking the front-end engineering and design ("FEED") of the facilities and pipeline, which is a continuation of work performed during the pre-FEED stage in fiscal year 2013, and which is expected to take approximately six months to complete. Based on engineering and design work already done, the Company is planning to run Dingo as a remote operation, with only wellheads and gathering lines to be located at the field itself. Production from the wells will flow through a pipeline approximately 30 miles in length to a processing facility to be located at Brewer Estate, an industrial facility located just south of Alice Springs, where the gas will be processed and where PWC will take delivery of the gas.
Concurrently with the FEED work, the Company will be applying for various regulatory permits and licenses to allow for the commercial production and sale of gas from Dingo, including (i) the grant of a production license over the area of the
current Dingo retention license, (ii) the grant of a pipeline license over the approximately 30-mile pipeline route connecting the Dingo field to Brewer Estate, and (iii) the grant of planning approval for the use of land at Brewer Estate for the installation and operation of a gas processing facilities. The Company expects that it will take approximately twelve months to receive all required permits and licenses to be able to start the construction phase of the surface facilities and pipeline necessary to commission the production of gas from Dingo. We began preliminary permitting work in July 2013 and expect the construction phase of the project to commence in early fiscal year 2015.
The Company currently intends to fund the development of Dingo primarily through the issuance of new project finance debt facilities, which it will service with cash flow generated by the Dingo GSPA once production commences. The Company also expects to supplement the project financing from its own cash resources. If project finance debt is not available under satisfactory terms, Magellan may seek to find a third party to build and own the pipeline, which third party would in turn charge the Company a tariff for the use of the pipeline over the life of the Dingo GSPA. Finally, the Company also intends to review strategic alternatives for its Amadeus Basin assets, Palm Valley and Dingo, over the course of the upcoming year.
NT/P82, Offshore Australia
In the first quarter of fiscal year 2014, the Company expects it will complete the processing and interpretation of 3-D and 2-D seismic surveys that the Company shot over part of NT/P82 in the Bonaparte Basin in December 2012. From preliminary results of the 2-D and 3-D seismic interpretation the Company expects to engage in a farmout process to identify a partner experienced in offshore drilling. In completing a farmout, the Company expects to relinquish a portion of its working interest in, and operatorship of NT/P82, in exchange for a commitment from the partner to drill exploration wells over the large gas prospects identified in the block by fiscal year 2015. Given the high level of offshore drilling activity in the Bonaparte Basin, the network of installed gas infrastructure in the relative vicinity of our block, and the relatively shallow depths of water in the license, the Company believes it is well positioned to successfully complete a farmout.
OPERATIONS
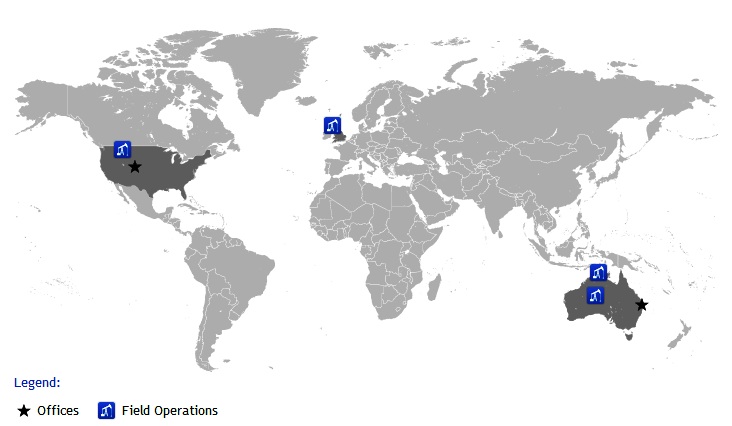
Magellan operates in the single industry segment of oil and gas exploration and production. We have three reportable geographic segments, NP, MPA, and MPUK, corresponding to our operations in the United States, Australia, and the UK, respectively. NP's oil and gas assets consist of its interests in Poplar in the Williston Basin. MPA's oil and gas assets consist of interests in the Palm Valley, Dingo, and Mereenie (prior to May 25, 2012) fields in the Amadeus Basin, onshore Australia; and NT/P82, an exploration block in the Bonaparte Basin, offshore Australia. MPUK's oil and gas assets consist of various exploration licenses in the Weald and Wessex Basins located onshore and offshore southern England. The locations of the Company's key oil and gas properties are presented in the map below. For certain additional information about the Company's reportable segments, see Note 11 to the consolidated financial statements included in Item 8: Financial Statements and Supplementary Data of this report.
Magellan's Areas of Operations
United States - Poplar
In the US, Magellan owns Poplar, an oil field located in Roosevelt County, Montana. Our acreage position covers substantially all of Poplar Dome, the largest geologic structure in the western Williston Basin with multiple stacked formations with hydrocarbon resource potential.
The field was discovered in the 1950s by Murphy Oil, who actively explored and developed the Charles formation for two decades. By the time Magellan acquired Poplar in 2009, technological advances in oil and gas exploration allowed us to reevaluate Poplar's known formations and to discover new ones.
Poplar, as the Company defines it, is composed of a 100% working interest in the oil and gas leases within the East Poplar Unit ("EPU"), a federal exploratory unit in Roosevelt County, Montana, totaling approximately 18,000 net acres, and the working interests in various oil and gas leases that are adjacent to or near EPU ("Northwest Poplar" or "NWP") totaling approximately 4,000 net acres.
Our interests within EPU (also referred to herein as "Poplar") include a 100% operated working interest in the interval from the surface to the top of the Bakken/Three Forks formation (the "Shallow Intervals") and an operated working interest below those intervals ranging from 50% to 65%, which include the Bakken/Three Forks, Nisku, and Red River formations (the "Deep Intervals"). VAALCO Energy (USA), Inc. ("VAALCO") owns the remaining working interest in the Deep Intervals. Our interests within NWP are all operated and are the same as within EPU, except in certain leases in which the Company and VAALCO collectively own less than 100% of the working interest.
Shallow Intervals. Magellan's primary objective in the Shallow Intervals is to establish the technical and economic viability of a CO2-EOR project in the Charles formation, in which the substantial volume of oil in place offers Magellan a chance to significantly increase its oil reserves. Secondarily, the Company intends to explore other formations within the Shallow Intervals prospectively for oil and gas production, including the Tyler and Amsden formations, as well as the Piper and Judith River formations.
Deep Intervals. Pursuant to the terms of the VAALCO Farmout entered into in September 2011, VAALCO drilled and completed three wells in the Deep Intervals in fiscal year 2012 and 2013 to ultimately earn a 50% non-operated working interest in the Deep Intervals. The original agreement with VAALCO granted a 65% working interest upon the drilling of three wells and was re-negotiated in March 2013 to grant VAALCO a 50% working interest in the Deep Intervals, subject to other
terms and conditions further discussed in Part II, Item 7 : Management's Discussion and Analysis of Financial Condition and Results of Operations of this report. Through this process, the Company was able to start evaluating the potential of various formations, including the Bakken/Three Forks, Nisku, and Red River. Although commercial quantities of oil and gas were not encountered with these three wells, the results of cores and logs are encouraging, and the Company may engage in further exploration of these formations at a later date.
Australia - Amadeus Basin
In the Amadeus Basin, located near Alice Springs in central Australia, Magellan owns 100% operated working interests in two gas fields, Palm Valley and Dingo.
Palm Valley. Palm Valley was discovered in 1965 and has been reliably producing natural gas since 1983. As of June 2013, the field has produced a cumulative total of 158 Bcf of gas. Through its direct connection to the Amadeus-Darwin Gas Pipeline, Palm Valley is able to meet the needs of its potential customers in Darwin, Northern Territory, and the mining operations adjacent to this pipeline. In 2011, Magellan entered into the Palm Valley GSPA with Santos whereby the Company has the ability to sell up to approximately 23 Bcf of natural gas, representing the majority of what the Company believes are the field's remaining gas reserves, over a 17-year period which began on May 25, 2012 to Santos, which onsells to third party customers. To date Santos has future sale commitments estimated at 11 Bcf of this gas. The deliverability of gas from existing wells and the firm sale commitments are crucial elements in determining the reserves that can be booked as proved reserves.
Dingo. Dingo is a gas field discovered in 1981. Four appraisal wells drilled between 1981 and 1991 established the field's resource and production potential. Magellan maintains its interest in Dingo through Retention License No. 2, which expires in February 2014, and is subject to renewal for a further five years. The Company has initiated the application process for an operating license that will allows us to maintain production for a 20-year period once received. Until recently, Northern Territory gas market dynamics have prevented the development of Dingo as a producing field. However, Magellan has entered into the Dingo GSPA with PWC for the sale of up to 31 PJ of gas (30 Bcf) over a 20-year period. Sales under the Dingo GSPA are expected to commence early in calendar year 2015. In the intervening time, Magellan will be focused on obtaining permits and licenses to commission Dingo for commercial production, completing the design, engineering, and construction of the surface facilities and the 30 mile tie-in to existing pipeline infrastructure. As of the date of this report, the Company has initiated the various permitting processes and expects the construction phase of the project to commence at the beginning of fiscal year 2015.
Australia - NT/P82
In the Timor Sea, offshore Northern Territory, Australia, Magellan holds a 100% interest in the exploration permit NT/P82, which covers 2,500 square miles of the Bonaparte Basin in water ranging in depth from 30 to 500 feet. The Company conducted 3-D and 2-D seismic surveys over portions of the license area in December 2012 and is currently in the final stages of interpreting this data. Under the terms of the permit, which is due to expire in May 2016, the Company is required to drill one exploratory well by May 2015. The Company currently intends to meet its work commitment through a farmout to another company.
United Kingdom
In the Weald and Wessex Basins, Magellan has interests in 10 PEDLs and one Seaward Production License (P1916), representing a total of approximately 200,000 net acres onshore and offering both oil and gas prospects through conventional and unconventional development.
Magellan's acreage position is composed of three groups of licenses: (i) four PEDLs co-owned 50% with, and operated by, Celtique; (ii) five licenses (four PEDLs and P1916) with varying ownership operated by Northern; and (iii) two licenses wholly owned and operated by Magellan. To date in the UK, Magellan has participated in conventional wells, the most recent being the Markwells Wood-1, which was drilled and operated by Northern in PEDL 126. In addition, Magellan has contributed, along with its partners, to the exploration of its other licenses in accordance with the terms of each PEDL.
The PEDL licensing regime in the UK, which is administered by the Department of Energy and Climate Change ("DECC"), allows for a 6-year initial exploration phase, which can be extended by an additional five years so long as pre-agreed work commitments have been met, for a maximum of an 11-year exploration phase from the original award date of a PEDL. Following the exploration phase, a PEDL will either convert into a production license with a term of approximately 20 years or transfer to the government and be made available for a new round of licensing. The licensing regime also requires that
50% of the acreage of a PEDL be relinquished at the end of the first six-year exploration period. This 50% relinquishment is expected to occur for most of Magellan's licenses in June 2014.
RESERVES
Estimates of reserves are inherently imprecise and continually subject to revision based on production history, results of additional exploration and development, price changes, and other factors.
The below table presents a summary of our proved and probable reserves as of June 30, 2013.
|
| | | | | | | | |
| Oil (Mbbls) | | Gas (Bcf) | | Total (Mboe)(1) |
Proved developed producing (PDP): | | | | | |
United States | 1,081 |
| | — |
| | 1,081 |
|
Australia | — |
| | 6 |
| | 1,000 |
|
Total | 1,081 |
| | 6 |
| | 2,081 |
|
| | | | | |
Proved developed not producing (PDNP): | | | | | |
United States | 500 |
| | — |
| | 500 |
|
Australia | — |
| | 5 |
| | 833 |
|
Total | 500 |
| | 5 |
| | 1,333 |
|
| | | | | |
Proved undeveloped (PUD): | | | | | |
United States | 5,787 |
| | — |
| | 5,787 |
|
Total | 5,787 |
| | — |
| | 5,787 |
|
| | | | | |
Total proved reserves | 7,368 |
| | 11 |
| | 9,201 |
|
| | | | | |
PDP% | 15 | % | | 55 | % | | 23 | % |
PDNP% | 7 | % | | 45 | % | | 14 | % |
PUD% | 78 | % | | — | % | | 63 | % |
| | | | | |
Probable: | | | | | |
Developed | — |
| | 13 |
| | 2,167 |
|
Undeveloped | 1,950 |
| | 29 |
| | 6,783 |
|
Total | 1,950 |
| | 42 |
| | 8,950 |
|
| | | | | |
Total proved and probable reserves | 9,318 |
| | 53 |
| | 18,151 |
|
| | | | | |
Proved % | 79 | % | | 21 | % | | 51 | % |
Probable % | 21 | % | | 79 | % | | 49 | % |
(1) Gas volumes are converted to Mboe at a rate of 6 MMcf of gas per Mbbl of oil based upon the approximate relative energy content of each fuel.
As of June 30, 2013, our consolidated total proved reserves amounted to 9,201 Mboe, comprised of 7,368 Mbbls (79%) of proved oil reserves and 11 Bcf (21%) of proved gas reserves. All of our proved and probable oil reserves relate to our interest in Poplar, Montana. Of the 7,368 Mbbls of proved oil reserves, approximately 7,328 Mbbls (99%), 35 Mbbls (0%), and 5 Mbbls (0%) were derived from the Charles, Tyler, and Amsden formations, respectively. All of the probable oil reserves were derived from the Tyler formation.
The Company's proved undeveloped reserves in the US consist of twenty infill drilling locations within EPU at Poplar targeting the Charles formation. These proved undeveloped reserves were identified and recorded in fiscal year 2010. In light of the Company's focus on CO2-EOR and the fact that none of these infill locations have been drilled to date, the Company decided to reduce this drilling program from 20 locations to 16 locations over the next two fiscal years. In their place, the Company will be drilling four producing wells as part of the CO2-EOR pilot project. To be conservative and due to the lack of
technical data available, we have decided not to include these wells in the Company's reserves estimates. The Company expects to conduct a similar review of its drilling program and impact on proved undeveloped reserves at the end of fiscal year 2014.
As of June 30, 2013, all of our proved gas reserves and 13 Bcf (45%) of our probable gas reserves related to our interest in Palm Valley in Australia. Under the terms of the Palm Valley GSPA, we are entitled to sell up to approximately 23 Bcf of gas from Palm Valley to Santos, who on-sells the gas to third-party customers. As of June 30, 2013, proved gas reserves totaled 11 Bcf, corresponding to gas sales volumes committed to third-party customers under the Palm Valley GSPA. The 42 Bcf of probable gas reserves correspond to the remaining volumes to be sold under the Palm Valley GSPA plus additional volumes of gas estimated to be economically recoverable from Dingo.
As of June 30, 2013, 29 Bcf (55%) of our probable gas reserves related to our interest in Dingo in Australia. In September 2013, Magellan entered into the Dingo GSPA with PWC for the sale of 31 PJ (30 Bcf) of gas over a 20-year period. Sales under the Dingo GSPA are expected to commence early in calendar year 2015. As a result of this contract, we believe that some of the probable reserves related to Dingo could be converted from probable to proved reserves as of June 30, 2014.
Proved Undeveloped Reserves
As of June 30, 2013, we had 5,787 Mboe of proved undeveloped reserves, representing a decrease of 1,471 Mboe, or 20%, over the prior year figure. During the fiscal year, we did not convert any proved undeveloped reserves to proved developed reserves.
As of June 30, 2013, we had no proved undeveloped reserves that had been on our books in excess of five years, and we had no material proved undeveloped locations that were more than one direct offset from an existing producing well.
Probable Reserves
Estimates of probable developed and undeveloped reserves are inherently imprecise. When estimating the amount of oil and gas that is recoverable from a particular reservoir, an estimated quantity of probable reserves is an estimate that more likely than not will not achieved. Estimates of probable reserves are continually subject to revision based on production history, results of additional exploration and development, price changes, and other factors.
We use deterministic methods to estimate probable reserve quantities, and when deterministic methods are used, it is as likely as not that actual remaining quantities recovered will exceed the sum of estimated proved plus probable reserves. Probable reserves may be assigned to areas of a reservoir adjacent to proved reserves where data control or interpretations of available data are less certain, even if the interpreted reservoir continuity of structure or productivity does not meet the reasonable certainty criterion. Probable reserves may be assigned to areas that are structurally higher than the proved area if these areas are in communication with the proved reservoir. Probable reserves estimates also include potential incremental quantities associated with a lower percentage recovery of the hydrocarbons in place than assumed for proved reserves.
Internal Controls Over Reserve Estimates
Our internal controls over the recording of proved reserves are structured to objectively and accurately estimate our reserve quantities and values in compliance with regulations established by the SEC. The Company relies upon a combination of internal technical staff and third party consulting arrangements for reserve estimation and review.
In the US, the responsibility for reserves estimation is delegated to Blaine Spies, Magellan's Operations Manager since December 2011. Mr. Spies has over 20 years of operation and technical engineering experience in the oil and gas industry. Prior to his appointment with Magellan, Mr. Spies was the Operations Manager at American Oil & Gas, responsible for drilling and completion operations in North Dakota. Mr. Spies also has experience in the Rocky Mountain and Gulf Coast regions. He received his Bachelors of Science in Petroleum Engineering from the Colorado School of Mines and his Masters in Business Administration from the Colorado Technical University.
In Australia, reserve estimates were prepared by the Ryder Scott Company ("RS"), an independent petroleum engineering firm, in accordance with the Company's internal control procedures, which include the verification of input data used by RS, and management review and approval.
Third Party Reserve Audit
In the US, reserve estimates were audited by Allen & Crouch Petroleum Engineers ("A&C"), an independent petroleum engineering firm. A copy of the summary reserve report of A&C is provided as Exhibit 99.1 to this Annual Report on Form 10-
K. A&C does not own an interest in any of Magellan's oil and gas properties and is not employed by Magellan on a contingent basis. In addition, A&C served as the reserves auditor for Jonah Bank of Wyoming with respect to NP's loan currently outstanding with Jonah Bank of Wyoming.
In Australia, reserve estimates were prepared by RS, an independent petroleum engineering firm. A copy of the summary reserve report of RS is provided as Exhibit 99.2 to this Annual Report on Form 10-K. RS does not own an interest in any of Magellan's oil and gas properties and is not employed by Magellan on a contingent basis.
Detailed information regarding reserves, costs of oil and gas activities, capitalized costs, discounted future net cash flows, and results of operations is disclosed in the supplemental information (see Note 16) to the consolidated financial statements of this Form 10-K.
VOLUMES AND REALIZED PRICES
The following table summarizes volumes and prices realized from the sale of oil and gas from properties in which we owned an interest during the periods stated. The table also summarizes operational costs per barrel of oil equivalent.
|
| | | | | | | | | | | | | | | | | | | | | | | | |
| Volumes | | Average realized price (2) | | Production costs (3) (Per boe)(1) |
| Oil (Mbbls) | | Gas (MMcf) | | Total (Mboe)(1) | | Oil (Per bbl) | | Gas (Per Mcf) | | Total (Per boe)(1) | |
Fiscal year ended June 30, 2013 | | | | | | | | | | | | | |
United States | 72 |
| | — |
| | 72 |
| | $ | 84.91 |
| | $ | — |
| | $ | 84.91 |
| | $ | 67.17 |
|
Australia | — |
| | 191 |
| | 32 |
| | $ | — |
| | $ | 4.93 |
| | $ | 29.56 |
| | $ | 68.86 |
|
Total | 72 |
| | 191 |
| | 104 |
| | $ | 84.91 |
| | $ | 4.93 |
| | $ | 68.01 |
| | $ | 67.62 |
|
| | | | | | | | | | | | | |
Fiscal year ended June 30, 2012 | | | | | | | | | | | | | |
United States | 75 |
| | — |
| | 75 |
| | $ | 82.66 |
| | $ | — |
| | $ | 82.66 |
| | $ | 70.06 |
|
Australia | 45 |
| | 434 |
| | 119 |
| | $ | 137.21 |
| | $ | 3.11 |
| | $ | 64.40 |
| | $ | 65.13 |
|
All other areas | 2 |
| | — |
| | 2 |
| | * |
| | * |
| | * |
| | * |
|
Total | 122 |
| | 434 |
| | 196 |
| | $ | 101.64 |
| | $ | 3.11 |
| | $ | 70.95 |
| | $ | 66.47 |
|
| | | | | | | | | | | | | |
Fiscal year ended June 30, 2011 | | | | | | | | | | | | | |
United States | 68 |
| | — |
| | 68 |
| | $ | 77.96 |
| | $ | — |
| | $ | 77.96 |
| | $ | 43.85 |
|
Australia | 55 |
| | 712 |
| | 174 |
| | $ | 98.60 |
| | $ | 2.26 |
| | $ | 47.27 |
| | $ | 36.10 |
|
Total | 123 |
| | 712 |
| | 242 |
| | $ | 96.11 |
| | $ | 2.26 |
| | $ | 56.27 |
| | $ | 38.28 |
|
(*) Not meaningful.
(1) Gas volumes are converted to Mboe at a rate of 6 MMcf of gas per Mbbl of oil based upon the approximate relative energy content of each fuel.
(2) Prices per bbl or per Mcf are reported net of royalties. However, it should be noted that current period prices may be influenced by prior period royalty adjustments arising from annual royalty audits.
(3) Production cost excludes severance taxes.
Total production declined from 196 Mboe in fiscal year 2012 to 104 Mboe in fiscal year 2013, primarily as a result of the termination of the PWC Palm Valley Contract in January 2012 and the impact of the Santos SA completed in May 2012. Production cost on a $/boe basis increased in Australia from $65.13/boe to $68.86/boe primarily due to decreased production, and decreased in the US from $70.06/boe to $67.17/boe primarily due to a fewer amount of work-overs in fiscal year 2013. These factors combined to increase production costs from $66.47/boe to $67.62/boe in the US and Australia, collectively.
PRODUCTIVE WELLS
Productive wells include producing wells and wells mechanically capable of production. In the US, all wells were located at Poplar and, in Australia, all gas wells were located at Palm Valley. The following table presents a summary of our productive wells by geography as of June 30, 2013.
|
| | | | | | | | | | | | | | | | | |
| Oil Wells | | Gas Wells | | Total Wells |
| Gross (1) | | Net (2) | | Gross (1) | | Net (2) | | Gross (1) | | Net (2) |
United States | 42.0 |
| | 40.4 |
| | — |
| | — |
| | 42.0 |
| | 40.4 |
|
Australia | — |
| | — |
| | 4.0 |
| | 4.0 |
| | 4.0 |
| | 4.0 |
|
Total | 42.0 |
| | 40.4 |
| | 4.0 |
| | 4.0 |
| | 46.0 |
| | 44.4 |
|
(1) A gross well is a well in which the Company owns a working interest. Wells with one or more completions in the same bore hole are considered to be one well.
(2) The number of net wells is the sum of the fractional working interests owned in gross wells.
DRILLING ACTIVITY
The following table summarizes the results of our development and exploratory drilling during the years ended:
|
| | | | | | | | | | | | | | | | | |
| June 30, |
| 2013 | | 2012 | | 2011 |
| Productive (2) | | Dry (3) | | Productive (2) | | Dry (3) | | Productive (2) | | Dry (3) |
Development wells, net (1): | | | | | | | | | | | |
United States | — |
| | — |
| | 4.0 |
| | 1.0 |
| | 1.0 |
| | — |
|
Total | — |
| | — |
| | 4.0 |
| | 1.0 |
| | 1.0 |
| | — |
|
| | | | | | | | | | | |
Exploratory wells, net (1): | | | | | | | | | | | |
United States | — |
| | — |
| | 1.0 |
| | — |
| | — |
| | — |
|
Total | — |
| | — |
| | 1.0 |
| | — |
| | — |
| | — |
|
| | | | | | | | | | | |
Total net wells | — |
| | — |
| | 5.0 |
| | 1.0 |
| | 1.0 |
| | — |
|
(1) The number of net wells is the sum of the fractional working interests owned in gross wells. The number of wells drilled refers to the number of wells completed at any time during the fiscal year, regardless of when drilling was initiated.
(2) A productive well is an exploratory, development, or extension well that is not a dry well.
(3) A dry well is an exploratory, development, or extension well that proves to be incapable of producing either oil or gas in sufficient quantities to justify completion as an oil or gas well. Completion refers to installation of permanent equipment for production of oil or gas, or, in the case of a dry well, to reporting to the appropriate authority that the well has been plugged and abandoned.
The following table summarizes the results, as of September 16, 2013, of our wells that were still in progress as of June 30, 2013.
|
| | | | | |
| Still in Progress |
| Gross (1) | | Net (2) |
United States (3) | 4.0 |
| | 3.4 |
|
Total | 4.0 |
| | 3.4 |
|
(1) A gross well is a well in which the Company owns a working interest. Wells with one or more completions in the same bore hole are considered to be one well.
(2) The number of net wells is the sum of the fractional working interests owned in gross wells.
(3) The four work in progress wells consist of the three wells drilled by VAALCO in the Deep Intervals, EPU 120, EPU 133-H, EPU 125, and the EPU 119, which remains under evaluation following a water shut-off treatment in January 2013.
ACREAGE
The following table summarizes gross and net developed and undeveloped acreage by geographic area at June 30, 2013.
|
| | | | | | | | | | | | | | | | | |
| Developed (1) | | Undeveloped (4) | | Total |
| Gross (2) | | Net (3) | | Gross (2) | | Net (3) | | Gross (2) | | Net (3) |
United States: | | | | | | | | | | | |
Poplar | 22,913 |
| | 21,997 |
| | — |
| | — |
| | 22,913 |
| | 21,997 |
|
| | | | | | | | | | | |
Australia: | | | | | | | | | | | |
Palm Valley | 41,644 |
| | 41,644 |
| | 116,288 |
| | 116,288 |
| | 157,932 |
| | 157,932 |
|
Dingo | — |
| | — |
| | 116,139 |
| | 116,139 |
| | 116,139 |
| | 116,139 |
|
NT/P82 | — |
| | — |
| | 1,566,647 |
| | 1,566,647 |
| | 1,566,647 |
| | 1,566,647 |
|
| | | | | | | | | | | |
United Kingdom | 80 |
| | 32 |
| | 373,137 |
| | 195,203 |
| | 373,217 |
| | 195,235 |
|
Total | 64,637 |
| | 63,673 |
| | 2,172,211 |
| | 1,994,277 |
| | 2,236,848 |
| | 2,057,950 |
|
(1) Developed acreage encompasses those leased acres assignable to productive wells. Our developed acreage that includes multiple formations may be considered undeveloped for certain formations but have been included as developed acreage in the presentation above.
(2) A gross acre is an acre in which the registrant owns a working interest.
(3) The number of net acres is the sum of the fractional working interests owned in gross acres.
(4) Undeveloped acreage encompasses those leased acres on which wells have not been drilled or completed to a point that would permit the production of economic quantities of oil or gas regardless of whether such acreage contains proved reserves.
Of our 22,913 gross acres at Poplar, approximately 18,000 acres (79%) form a federal exploratory unit which is held by economic production from any one well within the unit. Currently, Poplar contains 42 producing wells.
TITLES TO PROPERTY, PERMITS, AND LICENSES
Magellan maintains interests in its oil and gas properties through various contractual arrangements customary to the oil and gas industry and relevant to the local jurisdictions of its assets.
United States
In the US, Magellan maintains its working interests in oil and gas properties pursuant to leases from third parties. We have either commissioned title opinions or conducted title reviews on substantially all of our properties and believe we have title to them. Magellan obtains title opinions to a drill site prior to commencing initial drilling operations. In accordance with industry practice, we perform only minimal title review work at the time of acquiring undeveloped properties.
Australia
In Australia, all of Magellan's onshore permits are issued by the Northern Territory and are subject to the Petroleum (Prospecting and Mining) Act and the Petroleum Act of the Northern Territory. Lessees have the exclusive right to produce petroleum from the land subject to payment of a rental and a royalty at the rate of 10% of the wellhead value of the petroleum produced. Rental payments may be offset against the royalty paid. The term of a petroleum lease is typically 21 years, and leases may be renewed for successive terms of 21 years each.
The below table summarizes the permits we maintain in Australia as of June 30, 2013.
|
| | | | | | | | | | | | | | |
Permit | | Geologic basin | | Expiration date | | Operator | | Ownership interest | | Gross acres (1) | | Net acres (2) |
Petroleum Lease No. 3 (Palm Valley) | | Amadeus | | 11/7/2024 | | Magellan | | 100% | | 157,932 |
| | 157,932 |
|
Retention License No. 2 (Dingo) | | Amadeus | | 2/3/2014 | | Magellan | | 100% | | 116,139 |
| | 116,139 |
|
NT/P82 (Timor Sea) | | Bonaparte | | 5/12/2016 | | Magellan | | 100% | | 1,566,647 |
| | 1,566,647 |
|
Total | | | | | | | | | | 1,840,718 |
| | 1,840,718 |
|
(1) A gross acre is an acre in which the registrant owns a working interest.
(2) The number of net acres is the sum of the fractional working interests owned by registrant in gross acres.
United Kingdom
In the UK, Petroleum Exploration and Development Licenses ("PEDLs") and Seaward Production Licenses (denoted by a "P") issued by the government are subject to the Petroleum Act. A licensee has the exclusive right to produce, explore, and develop petroleum from the land subject to the payment of a rental payments to the UK government's Department of Energy and Climate Change ("DECC"). The maximum term of the license is 31 years. Licenses expire after the initial exploration term of 6 years if a well is not drilled and after 11 years if a well is drilled but no development program is approved by the Secretary of State for Energy and Climate Change.
The below table summarizes the permits we maintain in the UK as of June 30, 2013.
|
| | | | | | | | | | | | | | |
License | | Geologic basin | | Expiration date | | Operator | | Ownership interest | | Gross acres (1) | | Net acres (2) |
PEDL 126 | | Weald | | 6/30/2014 | | Northern | | 40% | | 30,124 |
| | 12,050 |
|
PEDL 137 | | Weald | | 9/30/2013 | | Magellan | | 100% | | 24,525 |
| | 24,525 |
|
PEDL 155 | | Weald | | 9/30/2015 | | Northern | | 40% | | 13,029 |
| | 5,212 |
|
PEDL 231 | | Weald | | 6/30/2014 | | Celtique | | 50% | | 98,800 |
| | 49,400 |
|
PEDL 232 | | Weald | | 6/30/2014 | | Celtique | | 50% | | 23,342 |
| | 11,671 |
|
PEDL 234 | | Weald | | 6/30/2014 | | Celtique | | 50% | | 74,100 |
| | 37,050 |
|
PEDL 240 | | Wessex | | 6/30/2014 | | Northern | | 23% | | 1,778 |
| | 409 |
|
PEDL 243 | | Weald | | 6/30/2014 | | Celtique | | 50% | | 74,100 |
| | 37,050 |
|
PEDL 246 | | Weald | | 6/30/2014 | | Magellan | | 100% | | 10,769 |
| | 10,769 |
|
PEDL 256 | | Weald | | 4/30/2015 | | Northern | | 40% | | 11,115 |
| | 4,446 |
|
P 1916 | | Wessex | | 1/31/2016 | | Northern | | 23% | | 11,535 |
| | 2,653 |
|
Total | | | | | | | | | | 373,217 |
| | 195,235 |
|
(1) A gross acre is an acre in which the registrant owns a working interest.
(2) The number of net acres is the sum of the fractional working interests owned by registrant in gross acres.
The PEDL 137 license, representing 24,525 gross and net acres, is due to expire in September 2013, however, pending our application to the UK Government is likely to be renewed for an additional 12 month period. The expiration of PEDL 137 would reduce our gross and net acres in the UK to 348,692 and 170,710 acres, respectively.
MARKETING ACTIVITIES AND CUSTOMERS
Customers
United States. In the US, the Company has a sole customer who accounted for 87% and 45%, of the consolidated revenues during the fiscal years ended June 30, 2013, and 2012, respectively.
Australia. In Australia, revenue from one customer accounted for approximately 13% and 0%, revenue from a second customer accounted for approximately 0%, and 45% of consolidated oil and gas production revenue for the years ended June 30, 2013, and 2012, respectively.
Delivery Commitments
Our production sales agreements contain customary terms and conditions with various parties that require us to deliver a fixed determinable quantity of product. In May 2012, Magellan commenced the Palm Valley GSPA with Santos, the terms of which provide for the sale by Magellan to Santos of a total contract gas quantity of 25.65 Petajoules over the 17 year term of the agreement, subject to certain limitations regarding deliverability into the Amadeus Pipeline. We are not obliged to deliver fixed quantities of gas under the Palm Valley GSPA other than that which we forecast for delivery over the ensuing 12 months. We can re-forecast quantities of gas every three months for the remainder of the contract year. If a shortfall in delivery of more than 10% occurs on any daily nomination by Santos, and confirmed for delivery by us, we incur a shortfall. If we shortfall on deliveries we can provide make-up gas in years 16 and 17 of the contract term. We will be required to make periodic deficiency payments for any shortfalls in delivering the minimum volume commitments. If a shortfall in the minimum volume commitment for natural gas is projected, we have certain rights to arrange for third party gas to be delivered into the gathering lines and such volume will count towards our minimum commitment. We believe our production and reserves are adequate to meet these delivery commitments.
CURRENT MARKET CONDITIONS AND COMPETITION
Seasonality of Business
Demand and prices for oil and gas can be impacted by seasonal factors. Increased demand for heating oil in the winter and gasoline during the summer driving season can positively impact the price of oil during those times. Increased demand for heating during the winter and air conditioning during the summer months can positively impact the price of natural gas. Unusual weather patterns can increase or dampen normal price levels. Our ability to carry out drilling activities can be adversely affected by weather conditions during winter months at Poplar. In general, the Company's working capital balances are not materially impacted by seasonal factors. In Australia, gas supply contracts are generally long term fixed price contracts and, as such, are unaffected by seasonality.
Competitive Conditions in the Business
The oil and gas industry is highly competitive. We face competition from numerous major and independent oil and gas companies, many of whom have greater technical, operational, and financial resources, or who have vertically integrated operations in areas such as pipelines and refining. Our ability to compete in this industry depends upon such factors as our ability to identify and economically acquire prospective oil and gas properties; the geological, geophysical, and engineering capabilities of management; the financial strength and resources of the Company; and our ability to secure drilling rigs and other oil field services in a timely and cost-effective manner. We believe our acreage positions, our management's technical and operational expertise, and the strength of our balance sheet allow us to effectively compete in the exploration and development of oil and gas projects.
The oil and gas industry itself faces competition from alternative fuel sources, which include other fossil fuels, such as coal and renewable energy sources.
EMPLOYEES AND OFFICE SPACE
As of June 30, 2013, the Company had a total of 39 full-time employees. We maintain approximately 6,000 square feet of functional office space in Denver, Colorado for our executive and administrative headquarters, and 4,435 square feet of office space in Brisbane, Australia.
GOVERNMENT REGULATIONS
Our business is extensively regulated by numerous foreign, US federal, state, and local laws and governmental regulations. These laws and regulations may be changed from time to time in response to economic or political conditions, or other developments, and our regulatory burden may increase in the future. Laws and regulations have the potential of increasing our cost of doing business and, consequently, could affect our results of operations. However, we do not believe that we are affected to a materially greater or lesser extent than others in our industry.
Regulations Applicable to Foreign Operations
Several of the properties in which we have interests are located outside of the US, and are subject to foreign laws, regulations, and related risks involved in the ownership, development, and operation of foreign property interests. Foreign laws and regulations may result in possible nationalization of assets, expropriation of assets, confiscatory taxation, changes in foreign exchange controls, currency revaluations, price controls or excessive royalties, export sales restrictions, and limitations on the transfer of interests in exploration licenses. Foreign laws and regulations may also limit our ability to transfer funds or proceeds from operations. In addition, foreign laws and regulations providing for conservation, proration, curtailment, cessation, or other limitations or controls on the production of or exploration for hydrocarbons may increase the costs or have other adverse effects on our foreign operations. As a result, an investment in us is subject to foreign legal and regulatory risks in addition to those risks inherent in US domestic oil and gas exploration and production company investments.
Our Australian operations are subject to stringent Australian laws and regulations relating to the release or disposal of materials into the environment or otherwise relating to environmental protection. These laws and regulations, which include the Environment Protection and Biodiversity Conservation Act 1999, require approval before seismic acquisition or drilling commences, restrict the types, quantities, and concentration of substances that can be released into the environment in connection with drilling and production activities, limit or prohibit seismic or drilling activities in protected areas, and impose substantial liabilities for pollution resulting from oil and gas operations. Failure to comply with these laws and regulations may result in the assessment of administrative, civil, and criminal penalties, incurrence of investigatory or remedial obligations, or
the imposition of injunctive relief. Changes in Australian environmental laws and regulations occur frequently, and any changes that result in more stringent or costly waste handling, storage, transport, disposal, or cleanup requirements could require us to make significant expenditures to maintain compliance, and may otherwise have a material adverse effect on our results of operations, competitive position, or financial condition as well. Under these environmental laws and regulations, we could be held strictly liable for the removal or remediation of previously released materials or property contamination, regardless of whether we were responsible for the release of such materials or if our operations were standard in the industry at the time they were performed.
Oil and gas exploration and production operations in the UK are subject to numerous UK and European Union ("EU") laws and regulations relating to environmental matters, health, and safety. Environmental matters are addressed before oil and gas production activities commence and during the exploration and production activities. Before a UK licensing round begins, the DECC will consult with various public bodies that have responsibility for the environment. Applicants for production licenses are required to submit a summary of their management systems and how those systems will be applied to the proposed work program. In addition, the Offshore Petroleum Production and Pipelines (Assessment of Environmental Effects) Regulations 1999 require the Secretary of State to exercise the Secretary's licensing powers under the UK Petroleum Act in such a way as to ensure that an environmental assessment is undertaken and considered before consent is given to certain projects. Further, depending on the scale of operations, production facilities may be subject to compliance obligations under the EU emissions trading system. Compliance with the above regulations may cause us to incur additional costs with respect to UK operations.
Energy Regulations
States in which we operate have adopted laws and regulations governing the exploration for, and production of, oil and gas, including laws and regulations that require (i) permits for the drilling of wells; (ii) impose bonding requirements in order to drill or operate wells; and (iii) govern the timing of drilling and location of wells, the method of drilling and casing wells, the surface use and restoration of properties upon which wells are drilled, and the plugging and abandonment of wells. Many of our operations are also subject to various state conservation laws and regulations, including regulations governing the size of drilling and spacing units or proration units, the number of wells that may be drilled in an area, the spacing of wells, and the unitization or pooling of oil and gas properties. In addition, state conservation laws sometimes establish maximum rates of production from oil and gas wells, generally prohibit the venting or flaring of gas, and may impose certain requirements regarding the ratability or fair apportionment of production from fields and individual wells.
Some of our operations are conducted on federal lands pursuant to oil and gas leases administered by the Bureau of Land Management ("BLM") and/or the Bureau of Indian Affairs ("BIA"). These leases contain relatively standardized terms and require compliance with detailed regulations and orders, that are subject to change. In addition to permits required from other regulatory agencies, lessees, such as Magellan, must obtain a permit from the BLM before drilling and must comply with regulations governing, among other things, engineering and construction specifications for production facilities, safety procedures, the valuation of production and payment of royalties, the removal of facilities, and the posting of bonds to ensure that lessee obligations are met. Under certain circumstances, the BLM or the BIA may suspend or terminate our operations on federal or Indian leases.
In May 2010, the BLM adopted changes to its oil and gas leasing program that require, among other things, a more detailed environmental review prior to leasing oil and natural gas resources, increased public engagement in the development of master leasing and development plans prior to leasing areas where intensive new oil and gas development is anticipated, and a comprehensive parcel review process. These changes have increased the amount of time and regulatory costs necessary to obtain oil and gas leases administered by the BLM.
Our sales of natural gas are affected by the availability, terms, and cost of gas pipeline transportation. The Federal Energy Regulatory Commission ("FERC") has jurisdiction over the transportation and sale for resale of natural gas in interstate commerce. FERC's current regulatory framework generally provides for a competitive and open access market for sales and transportation of natural gas. However, FERC regulations continue to affect the midstream and transportation segments of the industry, and thus can indirectly affect the sales prices we receive for natural gas production. In addition, the less stringent regulatory approach currently pursued by FERC and the US Congress may not continue indefinitely.
Environmental, Health, and Safety Matters
General. Our operations are subject to stringent and complex federal, state, tribal, and local laws and regulations governing protection of the environment and worker health and safety as well as the discharge of materials into the environment. These laws and regulations may, among other things:
| |
• | require the acquisition of various permits before drilling commences; |
| |
• | restrict the types, quantities, and concentration of various substances that can be released into the environment in connection with oil and natural gas drilling and production and saltwater disposal activities; |
| |
• | limit or prohibit drilling activities on certain lands lying within wilderness, wetlands, and other protected areas, including areas containing certain wildlife or threatened and endangered plant and animal species; and |
| |
• | require remedial measures to mitigate pollution from former and ongoing operations, such as requirements to close pits and plug abandoned wells. |
These laws, rules, and regulations may also restrict our ability to produce oil or gas a rate of oil and natural gas production that is lower than the rate that is otherwise possible. The regulatory burden on the oil and natural gas industry increases the cost of doing business in the industry and consequently affects profitability. Additionally, environmental laws and regulations are revised frequently, and any changes that result in more stringent and costly permitting, waste handling, disposal, and cleanup requirements for the oil and natural gas industry could have a significant impact on our operating costs.
The following is a summary of some of the existing laws, rules, and regulations to which our business is subject:
Waste handling. The Resource Conservation and Recovery Act (the "RCRA") and comparable state statutes regulate the generation, transportation, treatment, storage, disposal, and cleanup of hazardous and non-hazardous wastes. Under the auspices of the federal Environmental Protection Agency (the "EPA"), the individual states administer some or all of the provisions of the RCRA, sometimes in conjunction with their own, more stringent requirements. Drilling fluids, produced waters, and most of the other wastes associated with the exploration, development, and production of oil or natural gas are currently regulated under the RCRA's non-hazardous waste provisions. However, it is possible that certain oil and natural gas exploration and production wastes now classified as non-hazardous could be classified as hazardous wastes in the future. Any such change could result in an increase in our costs to manage and dispose of wastes, which could have a material adverse effect on our results of operations and financial position.
Comprehensive Environmental Response, Compensation and Liability Act. The Comprehensive Environmental Response, Compensation and Liability Act ("CERCLA"), also known as the Superfund law, imposes joint and several liability, without regard to fault or legality of conduct, on classes of persons who are considered to be responsible for the release of a hazardous substance into the environment. These persons include the owner or operator of the site where the release occurred, and anyone who disposed or arranged for the disposal of a hazardous substance released at the site. Under CERCLA, such persons may be subject to joint and several liability for the costs of cleaning up the hazardous substances that have been released into the environment, for damages to natural resources, and for the costs of certain health studies. In addition, it is not uncommon for neighboring landowners and other third-parties to file claims for personal injury and property damage allegedly caused by the hazardous substances released into the environment.
We currently own, lease, or operate numerous properties that have been used for oil and natural gas exploration and production for many years. Although we believe that we have utilized operating and waste disposal practices that were standard in the industry at the time, hazardous substances, wastes, or hydrocarbons may have been released on or under the properties owned or leased by us, or on or under other locations, including off-site locations, where such substances have been taken for disposal. In addition, some of our properties have been operated by third parties or by previous owners or operators whose treatment and disposal of hazardous substances, wastes, or hydrocarbons was not under our control. These properties and the substances disposed or released on them may be subject to CERCLA, RCRA, and analogous state laws. Under such laws, we could be required to remove previously disposed substances and wastes, remediate contaminated property, or perform remedial operations to prevent future contamination.
Water discharges. The federal Water Pollution Control Act (the "Clean Water Act") and analogous state laws impose restrictions and strict controls with respect to the discharge of pollutants, including spills and leaks of oil and other substances, into waters of the US and states. The discharge of pollutants into regulated waters is prohibited, except in accordance with the terms of a permit issued by the EPA, US Army Corps of Engineers, or analogous state agencies. Federal and state regulatory agencies can impose administrative, civil, and criminal penalties for non-compliance with discharge permits or other requirements of the Clean Water Act and analogous state laws and regulations.
The Oil Pollution Act of 1990 ("OPA") addresses prevention, containment and cleanup, and liability associated with oil pollution. The OPA applies to vessels, offshore platforms, and onshore facilities, and subjects owners of such facilities to strict liability for containment and removal costs, natural resource damages, and certain other consequences of oil spills into
jurisdictional waters. Any unpermitted release of petroleum or other pollutants from our operations could result in governmental penalties and civil liability.
Air emissions. The federal Clean Air Act ("CAA") and comparable state laws regulate emissions of various air pollutants through air emissions permitting programs and the imposition of other requirements. In addition, the EPA has developed, and continues to develop, stringent regulations governing emissions of toxic air pollutants at specified sources. Federal and state regulatory agencies can impose administrative, civil, and criminal penalties for non-compliance with air permits or other requirements of the federal CAA and associated state laws and regulations.
Climate change. In December 2009, the EPA determined that emissions of carbon dioxide, methane, and other "greenhouse gases" present an endangerment to public health and the environment because emissions of such gases are, according to the EPA, contributing to warming of the earth's atmosphere and other climatic changes. Based on these findings, the EPA has begun adopting and implementing a comprehensive suite of regulations to restrict emissions of greenhouse gases under existing provisions of the CAA. Legislative and regulatory initiatives related to climate change could have an adverse effect on our operations and the demand for oil and gas. See Item 1A, Risk Factors - Risks Related to Our Business - Legislative and regulatory initiatives related to global warming and climate change could have an adverse effect on our operations and the demand for crude oil and natural gas. In addition to the effects of regulation, the meteorological effects of global climate change could pose additional risks to our operations, including physical damage risks associated with more frequent, more intensive storms and flooding, and could adversely affect the demand for our products.
Endangered species. The federal Endangered Species Act and analogous state laws regulate activities that could have an adverse effect on threatened or endangered species. Some of our well drilling operations are conducted in areas where protected species are known to exist. In these areas, we may be obligated to develop and implement plans to avoid potential adverse impacts on protected species, and we may be prohibited from conducting drilling operations in certain locations or during certain seasons, such as breeding and nesting seasons, when our operations could have an adverse effect on the species. It is also possible that a federal or state agency could order a complete halt to drilling activities in certain locations if it is determined that such activities may have a serious adverse effect on a protected species. The presence of a protected species in areas where we perform drilling activities could impair our ability to achieve timely well drilling and development and could adversely affect our future production from those areas.
National Environmental Policy Act. Oil and natural gas exploration and production activities on federal and Indian lands are subject to the National Environmental Policy Act (the "NEPA"). NEPA requires federal agencies, including the Department of Interior, to evaluate major agency actions having the potential to significantly impact the environment. In the course of such evaluations, an agency will prepare an environmental assessment that assesses the potential direct, indirect, and cumulative impacts of a proposed project and, if necessary, will prepare a more detailed environmental impact statement that may be made available for public review and comment. All of our current exploration and production activities, as well as proposed exploration and development plans, on federal and Indian lands require governmental permits that are subject to the requirements of NEPA. This process has the potential to delay development of some of our oil and natural gas projects.
OSHA and other laws and regulations. We are subject to the requirements of the federal Occupational Safety and Health Act ("OSHA") and comparable state statutes. The OSHA hazard communication standard, the EPA community right-to-know regulations under Title III of CERCLA, and similar state statutes require that we organize and/or disclose information about hazardous materials used or produced in our operations. Also, pursuant to OSHA, the Occupational Safety and Health Administration has established a variety of standards relating to workplace exposure to hazardous substances and employee health and safety. We believe that we are in substantial compliance with the applicable requirements of OSHA and comparable laws.
Hydraulic fracturing. Hydraulic fracturing is an important and common practice that is used to stimulate production of hydrocarbons, particularly natural gas, from tight formations, including shales. While we have not routinely utilized hydraulic fracturing techniques in our drilling and completion programs in the past, that may change in the future in view of our potential shale play with Celtique in southern England, or if we expand our Bakken/Three Forks play of Poplar. The process involves the injection of water, sand, and chemicals under pressure into the formation to fracture the surrounding rock and stimulate production. The process is typically regulated by state oil and natural gas commissions, and in the UK a new Office of Unconventional Gas and Oil has recently been established to coordinate the related activities of various regulatory authorities. However, the EPA recently asserted federal regulatory authority over hydraulic fracturing involving diesel additives under the Safe Drinking Water Act's Underground Injection Control Program. The federal Safe Drinking Water Act protects the quality of the nation's public drinking water through the adoption of drinking water standards and controlling the injection of waste fluids into below-ground formations that may adversely affect drinking water sources.
Increased regulation and attention given to the hydraulic fracturing process could lead to greater opposition to oil and gas activities using hydraulic fracturing techniques, which could potentially cause a decrease in the completion of new oil and gas wells, increased compliance costs, and delays, all of which could adversely affect our financial position, results of
operations, and cash flows. For example, the UK government imposed a temporary moratorium on hydraulic fracturing in the UK that was lifted in December 2012. If new laws or regulations that significantly restrict hydraulic fracturing are adopted, such laws could make it more difficult or costly for us to perform fracturing to stimulate production from tight formations. In addition, if hydraulic fracturing becomes regulated at the federal level as a result of federal legislation or regulatory initiatives by the EPA, our fracturing activities could become subject to additional permitting requirements, and also to attendant permitting delays and potential increases in costs. Restrictions on hydraulic fracturing could also reduce the amount of oil and natural gas that we are ultimately able to produce from our reserves.
We believe that it is reasonably likely that the trend in environmental legislation and regulation will continue toward stricter standards. We believe that we are in substantial compliance with existing environmental laws and regulations applicable to our current operations and that our continued compliance with existing requirements will not have a material adverse impact on our financial condition and results of operations. However we cannot give any assurance that we will not be adversely affected in the future.
AVAILABLE INFORMATION
Our internet website address is www.magellanpetroleum.com. We routinely post important information for investors on our website, including updates about us and our operations. Within our website's investor relations section, we make available free of charge our annual report on Form 10-K, quarterly reports on Form 10-Q, current reports on Form 8-K, and any amendments to those reports filed with or furnished to the SEC under applicable securities laws. These materials are made available as soon as reasonably practical after we electronically file such materials with or furnish such materials to the SEC. We also make available within our website's corporate governance section the by-laws, code of conduct, and charters for the Audit Committee and the Compensation, Nominating and Governance Committee of the Board of Directors of Magellan. Information on our website is not incorporated by reference into this report and should not be considered part of this document.
NON-GAAP FINANCIAL MEASURES AND RECONCILIATION
Adjusted EBITDAX
We define Adjusted EBITDAX as net income (loss) attributable to Magellan, plus (minus): (i) depletion, depreciation, amortization, and accretion expense, (ii) exploration expense, (iii) stock based compensation expense, (iv) foreign transaction loss (gain), (v) impairment expense, (vi) loss (gain) on sale of assets, (vii) net interest expense (income), (viii) other expense (income), (ix) income tax provision (benefit), and (x) net loss (gain) attributable to non-controlling interest in subsidiaries. Adjusted EBITDAX is not a measure of net income or cash flow as determined by accounting principles generally accepted in the United States ("GAAP"), and excludes certain items that we believe affect the comparability of operating results.
Our Adjusted EBITDAX measure provides additional information which may be used to better understand our operations. Adjusted EBITDAX is one of several metrics that we use as a supplemental financial measurement in the evaluation of our business and should not be considered as an alternative to, or more meaningful than, net income (loss) as an indicator of our operating performance. Certain items excluded from Adjusted EBITDAX are significant components in understanding and assessing a company's financial performance, such as the historic cost of depreciable and depletable assets. Adjusted EBITDAX, as used by us, may not be comparable to similarly titled measures reported by other companies. We believe that Adjusted EBITDAX is a widely followed measure of operating performance and is one of many metrics used by our management team and by other users of our consolidated financial statements. For example, Adjusted EBITDAX can be used to assess our operating performance and return on capital in comparison to other independent exploration and production companies without regard to financial or capital structure, and to assess the financial performance of our assets and our company without regard to historical cost basis and items affecting the comparability of period to period operating results.
The following table provides a reconciliation of net (loss) income to Adjusted EBITDAX for the fiscal years ended:
|
| | | | | | | |
| June 30, |
| 2013 | | 2012 |
| (In thousands) |
NET (LOSS) INCOME APPLICABLE TO MAGELLAN PETROLEUM CORPORATION | $ | (19,767 | ) | | $ | 26,498 |
|
Depletion, depreciation, amortization, and accretion expense | 1,534 |
| | 1,744 |
|
Exploration expense | 8,267 |
| | 6,291 |
|
Stock based compensation expense | 848 |
| | 1,560 |
|
Foreign transaction loss (gain) | 18 |
| | (475 | ) |
Impairment expense | 890 |
| | 328 |
|
Gain on sale of assets | — |
| | (40,413 | ) |
Net interest income | (624 | ) | | (749 | ) |
Other income | (830 | ) | | (9 | ) |
Income tax benefit | (1,266 | ) | | (5,951 | ) |
Net loss attributable to non-controlling interest in subsidiaries | — |
| | (15 | ) |
Adjusted EBITDAX | $ | (10,930 | ) | | $ | (11,191 | ) |
For clarification purposes, the below tables provides an alternative method for calculating Adjusted EBITDAX, which can also be calculated as revenue less (i) lease operating expense and (ii) general and administrative expense; plus (i) stock based compensation expense and (ii) foreign transaction (gain) loss.
The following table provides the alternative method for calculating Adjusted EBITDAX for the fiscal years ended:
|
| | | | | | | |
| June 30, |
| 2013 | | 2012 |
| (In thousands) |
Total revenues | $ | 7,070 |
| | $ | 13,712 |
|
Less: | | | |
Lease operating | (7,037 | ) | | (12,897 | ) |
General and administrative | (11,829 | ) | | (13,091 | ) |
Plus: | | | |
Stock based compensation expense | 848 |
| | 1,560 |
|
Foreign transaction loss (gain) | 18 |
| | (475 | ) |
Adjusted EBITDAX | $ | (10,930 | ) | | $ | (11,191 | ) |
ITEM 1A: RISK FACTORS
In addition to the other information included in this report, the following risk factors should be carefully considered when evaluating an investment in us. These risk factors and other uncertainties may cause our actual future results or performance to differ materially from any future results or performance expressed or implied in the forward-looking statements contained in this report and in other public statements we make. In addition, because of these risks and uncertainties, as well as other variables affecting our operating results, our past financial performance is not necessarily indicative of future performance.
RISKS RELATING TO OUR BUSINESS
Our CO2-EOR project at Poplar may not be successful.
In August 2013, we initiated a five-well CO2-EOR pilot program for the Charles formation at the Poplar field to enhance oil recovery through the injection of CO2 into the formation, and we currently estimate that the total cost of the pilot program, including capital and certain operating expenditures over a two-year period, will be approximately $20.0 million. While laboratory analysis and other preliminary tests indicate that a CO2-EOR project at Poplar could be technically and economically viable on a full-field basis, the additional production and reserves that may result from CO2-EOR methods are inherently difficult to predict. If the results of the pilot program do not support the continued use of CO2-EOR methods at Poplar or if CO2-EOR methods ultimately do not allow for the extraction of additional oil in the manner or to the extent that we anticipate, our future results of operations, cash flows, and financial condition could be materially adversely affected. In addition, our ability to utilize CO2 as an enhanced recovery technique is subject to our ability to obtain sufficient quantities of CO2. Although we currently have a two-year CO2 supply agreement for the pilot program, if we become limited in the quantities of CO2 available to us, we may not have sufficient CO2 to produce oil in the manner or to the extent that we anticipate, and our future oil production volumes could be negatively impacted.
Substantially all of our currently producing properties are located in the Poplar field and the Palm Valley gas field, making us vulnerable to risks associated with having revenue-producing operations concentrated in a limited number of geographic areas.
Because our current revenue-producing operations are geographically concentrated in the Poplar field in the Montana portion of the Williston Basin and the Palm Valley gas field in the Australian Amadeus Basin, the success and profitability of our operations are disproportionally exposed to risks associated with regional factors. These include, among others, fluctuations in the prices of crude oil and natural gas produced from wells in the region, other regional supply and demand factors, including gathering, pipeline, and rail transportation capacity constraints, available rigs, equipment, oil field services, supplies, labor, and infrastructure capacity, and the effects of regional or local governmental regulations. In addition, our operations at Poplar may be adversely affected by seasonal weather and wildlife protection measures, which can intensify competition for the items described above during months when drilling is possible and may result in periodic shortages. The concentration of our operations in these regions also increases exposure to unexpected events that may occur in these regions such as natural disasters or labor difficulties. Any one of these events has the potential to cause a relatively significant number of our producing wells to be shut-in, delay operations and growth plans, decrease cash flows, increase operating and capital costs, and prevent development within originally anticipated time frames. Any of the risks described above could have a material adverse effect on our financial condition, results of operations, and cash flows.
Our Palm Valley production revenues and cash flows are concentrated with one long-term gas sales agreement and a limited number of ultimate customers.
Sales of our Palm Valley natural gas production are concentrated with a long-term gas supply agreement to sell up to a total of approximately 23 Bcf from Palm Valley over a 17-year period, which began on May 25, 2012, to Santos, who on-sells the gas to third party customers. As of June 30, 2013, there were two Santos customers receiving gas from Palm Valley. In the event this agreement becomes uneconomic or is unexpectedly breached or terminated, or designated volumes are decreased as permitted under the agreement, or currently anticipated ramp-ups in customer off-take volumes do not occur, our revenues and cash flows could be adversely impacted.
Our current niche strategy of marketing Amadeus Basin gas to the mining industry in central Australia may not be successful.
Our current strategy is dependent on the continued expansion of the mining industry in central Australia, and the mining industry's need for gas. If the mining industry slows or finds alternative fuel sources to gas from Palm Valley, our potential operating results could be adversely impacted.
Our Poplar production revenues and cash flows are concentrated with one purchaser, and that purchaser may reduce or discontinue purchases or become unable to meet its payment obligations to us.
Sales of our Poplar oil production are currently concentrated with an agreement with Plains Marketing, LP, who is the sole purchaser of our oil production at Poplar. If this purchaser reduces or discontinues purchases from us, or if we are unable to successfully negotiate a replacement agreement with this purchaser, who can terminate the agreement after a 90-day notice
period, or if the replacement agreement has less favorable terms, the effect on us could be adverse if we are unable to obtain new purchasers for the oil produced at Poplar. In addition, if this purchaser were to experience financial difficulties or any deterioration in its ability to satisfy its payment obligations to us, our revenues and cash flows from Poplar could be adversely affected.
Our use of 2-D and 3-D seismic data is subject to interpretation and may not accurately identify the presence of oil and natural gas, which could adversely affect the results of our Australian NT/P82 prospect and other exploration and development activities.
We have incurred significant expenditures to acquire extensive 2-D and 3-D seismic data with respect to our NT/P82 Exploration Permit area in the Bonaparte Basin, offshore Northern Territory, Australia, and we use 2-D and 3-D seismic data in our other exploration and development activities. Even when properly used and interpreted, 2-D and 3-D seismic data and visualization techniques are only tools used to assist geoscientists in identifying subsurface structures and hydrocarbon indicators and do not enable the interpreter to know whether hydrocarbons are, in fact, present in those structures. In addition, the use of 3-D seismic and other advanced technologies requires greater predrilling expenditures than traditional drilling strategies, and we could incur losses as a result of such expenditures. As a result, our drilling activities may not be successful or economical.
Regulations related to hydraulic fracturing could result in increased costs and operating restrictions or delays that could affect the value of our potential unconventional play in the United Kingdom.
We along with Celtique Energie have a 50%-50% working interest in a potential unconventional play in southern England that is operated by Celtique. Hydraulic fracturing is an important common practice that is used to stimulate production of hydrocarbons, particularly natural gas, from tight formations, including unconventional gas resources. The process involves the injection of water, sand, and chemicals under pressure into formations to fracture the surrounding rock and stimulate production. Although the UK government lifted a temporary moratorium on hydraulic fracturing in December 2012 and a new Office of Unconventional Gas and Oil has recently been established in the UK to coordinate the related activities of various regulatory authorities, hydraulic fracturing remains a publicly controversial topic, with media and local community concerns regarding the use of fracturing fluids, impacts on drinking water supplies, and the potential for impacts to surface water, groundwater, and the environment generally. If hydraulic fracturing is significantly restricted or delayed at our potential unconventional play in the UK, or made more costly, the volumes of natural gas that can be economically recovered could be reduced, which would adversely affect the value of the play.
Our acquisitions of or investments in new oil and gas properties or other assets may not be worth what we pay due to uncertainties in evaluating recoverable reserves and other expected benefits, as well as potential liabilities.
Successful property or other acquisitions or investments require an assessment of a number of factors sometimes beyond our control. These factors include exploration potential, future crude oil and natural gas prices, operating costs, and potential environmental and other liabilities. These assessments are not precise, and their accuracy is inherently uncertain.
In connection with our acquisitions or investments, we typically perform a customary review of the properties that will not necessarily reveal all existing or potential problems. In addition, our review may not allow us to fully assess the potential deficiencies of the properties. We do not inspect every well, and even when we inspect a well we may not discover structural, subsurface, or environmental problems that may exist or arise. We may not be entitled to contractual indemnification for pre-closing liabilities, including environmental liabilities. Normally, we acquire interests or otherwise invest in properties on an "as is" basis with limited remedies for breaches of representations and warranties.
In addition, significant acquisitions can change the nature of our operations and business if the acquired properties have substantially different operating and geological characteristics or are in different geographic locations than our existing properties. To the extent acquired properties are substantially different than our existing properties, our ability to efficiently realize the expected economic benefits of such acquisitions may be limited.
Integrating acquired properties and businesses involves a number of other special risks, including the risk that management may be distracted from normal business concerns by the need to integrate operations and systems as well as retain and assimilate additional employees. Therefore, we may not be able to realize all of the anticipated benefits of our acquisitions.
These factors could have a material adverse effect on our business, financial condition, results of operations, and cash flows. Consideration paid for any future acquisitions or investments could include our stock or require that we incur additional debt and contingent liabilities. As a result, future acquisitions or investments could cause dilution of existing equity interests
and earnings per share.
Exploration and development drilling may not result in commercially producible reserves.
Crude oil and natural gas drilling and production activities are subject to numerous risks, including the risk that no commercially producible crude oil or natural gas will be found. The cost of drilling and completing wells is often uncertain, and crude oil or natural gas drilling and production activities may be shortened, delayed, or canceled as a result of a variety of factors, many of which are beyond our control. These factors include:
| |
• | unexpected drilling conditions; |
| |
• | disputes with owners or holders of surface interests on or near areas where we intend to drill; |
| |
• | pressure or geologic irregularities in formations; |
| |
• | engineering and construction delays; |
| |
• | equipment failures or accidents; |
| |
• | adverse weather conditions; |
| |
• | compliance with environmental and other governmental requirements; and |
| |
• | shortages or delays in the availability of or increases in the cost of drilling rigs and crews, equipment, pipe, water, and other supplies. |
The prevailing prices for crude oil and natural gas affect the cost of and demand for, drilling rigs, completion and production equipment, and other related services. However, changes in costs may not occur simultaneously with corresponding changes in commodity prices. The availability of drilling rigs can vary significantly from region to region at any particular time. Although land drilling rigs can be moved from one region to another in response to changes in levels of demand, an undersupply of rigs in any region may result in drilling delays and higher drilling costs for the rigs that are available in that region. In addition, the recent economic and financial downturn has adversely affected the financial condition of some drilling contractors, which may constrain the availability of drilling services in some areas.
Another significant risk inherent in drilling plans is the need to obtain drilling permits from state, local, and other governmental authorities. Delays in obtaining regulatory approvals and drilling permits, including delays that jeopardize our ability to realize the potential benefits from leased properties within the applicable lease periods, the failure to obtain a drilling permit for a well, or the receipt of a permit with unreasonable conditions or costs could have a materially adverse effect on our ability to explore on or develop the properties we have or may acquire.
The wells we drill may not be productive and we may not recover all or any portion of our investment in such wells. The seismic data and other technologies we use do not allow us to know conclusively prior to drilling a well if crude oil or natural gas is present, or whether it can be produced economically. The cost of drilling, completing, and operating a well is often uncertain, and cost factors can adversely affect the economics of a project. Drilling activities can result in dry holes or wells that are productive but do not produce sufficient net revenues after operating and other costs to cover initial drilling and completion costs.
Our future drilling activities may not be successful. Although we have identified potential drilling locations, we may not be able to economically produce oil or natural gas from them.
We may not be successful in sharing the exploration and development costs of the fields and permits in which we hold interests.
Our drilling plans depend, in certain cases, on our ability to enter into farm-in, joint venture, or other cost sharing arrangements with other oil and gas companies. If we are not able to secure such farm-in or other arrangements in a timely manner, or on terms which are economically attractive to us, we may be forced to bear higher exploration and development costs with respect to our fields and interests. We may also be unable to fully develop and/or explore certain fields if the costs to do so would exceed our available exploration budget and capital resources. In either case, our results of operations could be adversely affected and the market price of our common stock could decline.
The loss of key personnel could adversely affect our ability to operate.
We depend, and will continue to depend in the foreseeable future, on the services of our executive management team and other key personnel. The ability to retain officers and key employees is important to our success and growth. The unexpected loss of the services of one or more of these individuals could have a detrimental effect on our business. Our drilling success and the success of other activities integral to our operations will depend, in part, on our ability to attract and retain experienced geologists, engineers, landmen, and other professionals. Competition for many of these professionals is intense. If we cannot retain our technical personnel or attract additional experienced technical personnel and professionals, our ability to compete could be harmed.
There are risks inherent in foreign operations, such as adverse changes in currency values and foreign regulations relating to MPA's exploration and development operations and to MPA's payment of dividends to Magellan.
The properties in which we have interests that are located outside the US are subject to certain risks related to the indirect ownership and development of foreign properties, including government expropriation and nationalization, adverse changes in currency values and foreign exchange controls, foreign taxes, US taxes on the repatriation of funds to the US, and other laws and regulations, any of which may have a material adverse effect on our properties, financial condition, results of operations, or cash flows. Although there are currently no exchange controls on the payment of dividends to Magellan by MPA, such payments could be restricted by Australian foreign exchange controls, if implemented.
We have limited management and staff and will be dependent upon partnering arrangements.
We had 39 total employees as of June 30, 2013. Due to our limited number of employees, we expect that we will continue to require the services of independent consultants and contractors to perform various professional services, including reservoir engineering, land, legal, environmental, and tax services. We also plan to pursue alliances with partners in the areas of geological and geophysical services and prospect generation, evaluation, and prospect leasing. Our dependence on third party consultants and service providers creates a number of risks, including but not limited to:
| |
• | the possibility that such third parties may not be available to us as and when needed; and |
| |
• | the risk that we may not be able to properly control the timing and quality of work conducted with respect to our projects. |
If we experience significant delays in obtaining the services of such third parties or poor performance by such parties, our results of operations may be materially adversely affected.
Oil and natural gas prices are volatile. A decline in prices could adversely affect our financial condition, results of operations, cash flows, access to capital, and ability to grow.
Our revenues, results of operations, future rate of growth, and the carrying value of our oil and gas properties depend heavily on the prices we receive for the crude oil and natural gas we sell. Prices also affect the amount of cash flow available for capital expenditures and our ability to borrow money or raise additional capital. The markets for crude oil and natural gas have historically been, and are likely to continue to be, volatile and subject to wide fluctuations in response to numerous factors, including the following:
| |
• | worldwide and domestic supplies of oil and gas, and the productive capacity of the oil and gas industry as a whole; |
| |
• | changes in the supply and the level of consumer demand for such fuels; |
| |
• | overall global and domestic economic conditions; |
| |
• | political conditions in oil, natural gas, and other fuel-producing and fuel-consuming areas; |
| |
• | the extent of US and Australian domestic oil and gas production and the consumption and importation of such fuels and substitute fuels in US, Australian, and other relevant markets; |
| |
• | the availability and capacity of gathering, transportation, processing, and/or refining facilities in regional or localized areas that may affect the realized price for crude oil or natural gas; |
| |
• | the price and level of foreign imports of crude oil, refined petroleum products, and liquefied natural gas; |
| |
• | weather conditions, including effects of weather conditions on prices and supplies in worldwide energy markets; |
| |
• | technological advances affecting energy consumption and conservation; |
| |
• | the ability of the members of the Organization of Petroleum Exporting Countries and other exporting countries to agree to and maintain crude oil prices and production controls; |
| |
• | the competitive position of each such fuel as a source of energy as compared to other energy sources; |
| |
• | strengthening and weakening of the US dollar relative to other currencies; and |
| |
• | the effect of governmental regulations and taxes on the production, transportation, and sale of oil, natural gas, and other fuels. |
These factors and the volatility of the energy markets make it extremely difficult to predict future oil and gas price movements with any certainty, but in general we expect oil and gas prices to continue to fluctuate significantly.
Sustained declines in oil and gas prices would not only reduce our revenues but also could reduce the amount of oil and gas that we can produce economically and, as a result, could have a material adverse effect on our financial condition, results of operations, cash flows, and reserves. Further, oil and gas prices do not necessarily move in tandem. Gas sales contracts in Australia are adjusted to the Australian Consumer Price Index. Future gas sales not governed by existing contracts would generate lower revenue if natural gas prices in Australia were to decline. Prices for sales of our oil production are primarily affected by global oil prices, and the volatility of those prices will affect future oil revenues.
Competition in the oil and natural gas industry is intense, and many of our competitors have greater financial, technical, and other resources than we do.
We face intense competition from major oil and gas companies and independent oil and gas exploration and production companies who seek oil and gas investments throughout the world, as well as the equipment, expertise, labor, and materials required to explore, develop, and operate crude oil and natural gas properties. Many of our competitors have financial, technical, and other resources vastly exceeding those available to us, and many crude oil and natural gas properties are sold in a competitive bidding process in which our competitors may be able and willing to pay more for development prospects and productive properties, or in which our competitors have technological information or expertise that is not available to us to evaluate and successfully bid for the properties. In addition, shortages of equipment, labor, or materials as a result of intense competition may result in increased costs or the inability to obtain those resources as needed. We may not be successful in acquiring, exploring, and developing profitable properties in the face of this competition.
We also compete for human resources. Over the last few years, the need for talented people across all disciplines in the industry has grown, while the number of talented people available has not grown at the same pace, and in many cases, is declining due to the demographics of the industry.
Our operations are subject to complex laws and regulations, including environmental regulations that result in substantial costs and other risks.
US federal, state, tribal, and local authorities, and corresponding Australian and UK governmental authorities, extensively regulate the oil and natural gas industry. Legislation and regulations affecting the industry are under constant review for amendment or expansion, raising the possibility of changes that may become more stringent and, as a result, may affect, among other things, the pricing or marketing of crude oil and natural gas production. Noncompliance with statutes and regulations and more vigorous enforcement of such statutes and regulations by regulatory agencies may lead to substantial administrative, civil, and criminal penalties, including the assessment of natural resource damages, the imposition of significant investigatory and remedial obligations, and may also result in the suspension or termination of our operations. The overall regulatory burden on the industry increases the cost to place, design, drill, complete, install, operate, and abandon wells and related facilities and, in turn, decreases profitability.
Governmental authorities regulate various aspects of drilling for and the production of crude oil and natural gas, including the permit and bonding requirements of drilling wells, the spacing of wells, the unitization or pooling of interests in crude oil and natural gas properties, rights-of-way and easements, environmental matters, occupational health and safety, the sharing of markets, production limitations, plugging, abandonment, and restoration standards, and oil and gas operations. Public interest in environmental protection has increased in recent years, and environmental organizations have opposed, with some success, certain projects. Under certain circumstances, regulatory authorities may deny a proposed permit or right-of-way grant or impose conditions of approval to mitigate potential environmental impacts, which could, in either case, negatively affect our ability to explore or develop certain properties. Governmental authorities also may require any of our ongoing or planned operations on their leases or licenses to be delayed, suspended, or terminated. Any such delay, suspension, or termination could have a material adverse effect on our operations.
Our operations are also subject to complex and constantly changing environmental laws and regulations adopted by federal, state, tribal, and local governmental authorities in jurisdictions where we are engaged in exploration or production operations. New laws or regulations, or changes to current requirements, could result in material costs or claims with respect to properties we own or have owned. We will continue to be subject to uncertainty associated with new regulatory interpretations and inconsistent interpretations between various regulatory agencies. Under existing or future environmental laws and regulations, we could incur significant liability, including joint and several liability or strict liability under federal, state, and tribal environmental laws for noise emissions and for discharges of crude oil, natural gas, and associated liquids or other pollutants into the air, soil, surface water, or groundwater. We could be required to spend substantial amounts on investigations, litigation, and remediation for these discharges and other compliance issues. Any unpermitted release of petroleum or other pollutants from our operations could result not only in cleanup costs but also natural resources, real or personal property, and other compensatory damages and civil and criminal liability. Existing environmental laws or regulations, as currently interpreted or enforced, or as they may be interpreted, enforced, or altered in the future, may have a material adverse effect on us.
Legislative and regulatory initiatives related to global warming and climate change could have an adverse effect on our operations and the demand for crude oil and natural gas.
Due to concerns about the risks of global warming and climate change, a number of various national and regional legislative and regulatory initiatives to limit greenhouse gas emissions are currently in various stages of discussion or implementation. For example, the US Environmental Protection Agency has been adopting and implementing various rules regulating greenhouse gas emissions under the US Clean Air Act, the US Congress has from time to time considered other legislative initiatives to reduce emissions of greenhouse gases, and almost one-half of the states have already taken legal measures to reduce emissions of greenhouse gases, primarily through the planned development of greenhouse gas emission inventories and/or regional greenhouse gas cap and trade programs. Most of these cap and trade programs work by requiring major sources of emissions, such as electric power plants, or major producers of fuels, such as refineries and gas processing plants, to acquire and surrender emission allowances. The number of allowances available for purchase is reduced each year in an effort to achieve the overall greenhouse gas emission reduction goal.
Legislative and regulatory programs to reduce emissions of greenhouse gases could require us to incur substantially increased capital, operating, maintenance, and compliance costs, such as costs to purchase and operate emissions control systems, costs to acquire emissions allowances, and costs to comply with new regulatory or reporting requirements. Any such legislative or regulatory programs could also increase the cost of consuming, and thereby reduce demand for, the oil and natural gas we produce. Consequently, legislative and regulatory programs to reduce emissions of greenhouse gases could have an adverse effect on our business, financial condition, results of operations, and cash flows.
In addition, there has been public discussion that climate change may be associated with more extreme weather conditions, such as increased frequency and severity of storms, droughts, and floods. Extreme weather conditions can interfere with our development and production activities, increase our costs of operations or reduce the efficiency of our operations, and potentially increase costs for insurance coverage in the aftermath of such conditions. Significant physical effects of climate change could also have an indirect effect on our financing and operations by disrupting the transportation or process related services provided by midstream companies, service companies, or suppliers with whom we have a business relationship. We may not be able to recover through insurance some or any of the damages, losses, or costs that may result from potential physical effects of climate change.
Our estimated reserves are based on many assumptions that may turn out to be inaccurate. Any significant inaccuracies in these reserve estimates or underlying assumptions may materially affect the quantities and present value of our reserves.
This report contains estimates of our proved and probable reserves and the estimated future net revenues from our proved reserves. These estimates are based upon various assumptions, including assumptions required by the SEC relating to oil and gas prices, drilling and operating expenses, capital expenditures, taxes, and availability of funds. The process of estimating oil and gas reserves is complex. The process involves significant decisions and assumptions in the evaluation of available geological, geophysical, engineering, and economic data for each reservoir. Actual future production, oil and gas prices, revenues, taxes, development expenditures, operating expenses, and quantities of recoverable oil and gas reserves will most likely vary from these estimates. Any significant variation of any nature could materially affect the estimated quantities and present value of our proved reserves, and the actual quantities and present value may be significantly less than we have previously estimated. In addition, we may adjust estimates of proved reserves to reflect production history, results of exploration and development drilling, prevailing oil and natural gas prices, costs to develop and operate properties, and other factors, many of which are beyond our control. Our properties may also be susceptible to hydrocarbon drainage from
production by operators on adjacent properties. Probable reserves are less certain to be recovered than proved reserves.
The present value of future net cash flows from our proved reserves is not necessarily the same as the current market value of our estimated oil and natural gas reserves. We base the estimated discounted future net cash flows from our proved reserves on the average, first-day-of-the-month price during the 12-month period preceding the measurement date, in accordance with SEC rules. However, actual future net cash flows from our oil and natural gas properties also will be affected by factors such as:
| |
• | actual prices we receive for oil and natural gas; |
| |
• | actual costs of development and production expenditures; |
| |
• | the amount and timing of actual production; |
| |
• | supply of and demand for oil and natural gas; and |
| |
• | changes in governmental regulations or taxation, including severance and excise taxes. |
The timing of production from oil and natural gas properties and of related expenses affects the timing of actual future net cash flows from proved reserves, and thus their actual present value. In addition, the 10% discount factor required by the SEC to be used to calculate discounted future net cash flows for reporting purposes may not be the most appropriate discount factor in view of actual interest rates, costs of capital, and other risks to which our business or the oil and natural gas industry in general are subject.
SEC rules could limit our ability to book additional proved undeveloped reserves in the future.
SEC rules require that, subject to limited exceptions, proved undeveloped reserves may only be booked if they relate to wells scheduled to be drilled within five years after the date of booking. This requirement may limit our ability to book additional proved undeveloped reserves as we pursue drilling programs on our undeveloped properties. In addition, we may be required to write down our proved undeveloped reserves if we do not drill the scheduled wells within the required five-year timeframe.
Substantial capital is required for our business.
Our exploration, development, and acquisition activities require substantial capital expenditures. Historically, we have funded our capital expenditures through a combination of cash flows from operations, farming-in other companies or investors to our exploration and development projects in which we have an interest, and/or equity financings. Future cash flows are subject to a number of variables, such as the level of production from existing wells, prices for oil and natural gas, and our success in developing and producing new reserves. If revenues decrease as a result of lower oil or natural gas prices or decreased production, and our access to capital were limited, we would have a reduced ability to explore and develop our properties and replace our reserves. If our cash flows from operations are not sufficient to fund our planned capital expenditures, we must reduce our capital expenditures unless we can raise additional capital through debt, equity, or other financings or the divestment of assets. Debt or equity financing may not always be available to us in sufficient amounts or on acceptable terms, and the proceeds offered to us for potential divestitures may not always be of acceptable value to us.
If we are not able to replace reserves, we will not be able to sustain production.
Our future success depends largely upon our ability to find, develop, or acquire additional oil and gas reserves that are economically recoverable. Unless we replace the reserves we produce through successful exploration, development, or acquisition activities, our reserves will decline over time. Recovery of any additional reserves will require significant capital expenditures and successful drilling operations. We may not be able to successfully find and produce reserves economically in the future. In addition, we may not be able to acquire proved reserves at acceptable costs.
Future price declines may result in write-downs of our asset carrying values.
We follow the successful efforts method of accounting for our oil and gas operations. Under this method, all property acquisition costs and costs of exploratory and development wells are capitalized when incurred, pending determination of whether proved reserves have been discovered. If proved reserves are not discovered with an exploratory well, the costs of drilling the well are expensed.
The capitalized costs of our oil and natural gas properties, on a depletion pool basis, cannot exceed the estimated
undiscounted future net cash flows of that depletion pool. If net capitalized costs exceed undiscounted future net revenues, we generally must write down the costs of each depletion pool to the estimated discounted future net cash flows of that depletion pool. For Palm Valley, future undiscounted cash flows were based upon the quantities of gas currently committed to the current contract and estimated sales subsequent to the contract. A significant decline in oil or natural gas prices from current levels, or other factors, could cause a future impairment write-down of capitalized costs and a non-cash charge against future earnings. Once incurred, a write-down of oil and natural gas properties cannot be reversed at a later date, even if oil or natural gas prices increase.
Oil and gas drilling and producing operations are hazardous and expose us to environmental liabilities.
Oil and gas operations are subject to many risks, including well blowouts, cratering and explosions, pipe failure, fires, formations with abnormal pressures, uncontrollable flows of oil, natural gas, brine, or well fluids, and other environmental hazards and risks. Our drilling operations involve risks from high pressures and from mechanical difficulties such as stuck pipes, collapsed casings, and separated cables. If any of these risks occur, we could sustain substantial losses as a result of:
| |
• | severe damage to, or destruction of, property, natural resources, and equipment; |
| |
• | pollution or other environmental damage; |
| |
• | clean-up responsibilities; |
| |
• | regulatory investigations and penalties; and |
| |
• | suspension of operations. |
Our liability for environmental hazards may include those created either by the previous owners of properties that we purchase or lease or by acquired companies prior to the date we acquire them. We maintain insurance against some, but not all, of the risks described above. Our insurance may not be adequate to cover casualty losses or liabilities, and in the future we may not be able to obtain insurance at premium levels that justify its purchase.
Weakness in economic conditions or uncertainty in financial markets may have material adverse impacts on our business that we cannot predict.
US, Australian, and global economies and financial systems have recently experienced turmoil and upheaval characterized by extreme volatility and declines in prices of securities, diminished liquidity and credit availability, inability to access capital markets, the bankruptcy, failure, collapse, or sale of financial institutions, increased levels of unemployment, and an unprecedented level of government intervention. Although some portions of the economy appear to have stabilized and begun to recover, the extent and timing of recovery, and whether it can be sustained, are uncertain. Continued weakness in the US, Australian, or other large economies could materially adversely affect our business, financial condition, results of operations, and cash flows. For example, purchasers of our oil and gas production may reduce the amounts of oil and gas they purchase from us and/or delay or be unable to make timely payments to us.
In addition, some of our oil and gas properties are operated by third parties that we depend on for timely performance of drilling and other contractual obligations and, in some cases, for distribution to us of our proportionate share of revenues from sales of oil and natural gas production. If weak economic conditions adversely impact our third party operators, we are exposed to the risk that drilling operations or revenue disbursements to us could be delayed or suspended.
We have limited control over the activities on properties we do not operate.
Some of the properties in which we have an ownership interest are operated by other companies. As a result, we have limited ability to exercise influence over, and control the risks associated with, the development and operation of those properties. The timing and success of drilling and development activities on those properties depend on a number of factors outside of our control, including the operator's:
| |
• | determination of the nature and timing of drilling and operational activities; |
| |
• | determination of the timing and amount of capital expenditures; |
| |
• | expertise and financial resources; |
| |
• | approval of other participants in drilling wells; and |
| |
• | selection of suitable technology. |
The failure of an operator of our properties to adequately perform development and operational activities, an operator's breach of the applicable agreements, or an operator's failure to act in ways that are in our best interests could reduce our production, revenues, and reserves, and have a material adverse effect on our financial condition, results of operations, and cash flows.
Currency exchange rate fluctuations may negatively affect our operating results.
The exchange rates between the Australian dollar and the US dollar, as well as the exchange rates between the US dollar and the British pound, have changed in recent periods and may fluctuate substantially in the future. We expect that a majority of our revenues will be denominated in US dollars in the future. However, at June 30, 2013, the US dollar has strengthened against the Australian dollar, which has had, and may continue to have, a negative impact on our revenues generated in the Australian dollar, as well as our operating income and net income on a consolidated basis. The foreign exchange gain for the fiscal year ended June 30, 2013, was $18 thousand and is included under general and administrative expenses in the consolidated statements of operations. Any appreciation of the US dollar against the Australian dollar is likely to have a positive impact on our revenue, operating income, and net income. Because of our UK development program, a portion of our expenses, including exploration costs and capital and operating expenditures, will continue to be denominated in British pounds. Accordingly, any material appreciation of the British pound against the US dollar could have a negative impact on our business, operating results, and financial condition.
Proposed changes to US tax laws, if adopted, could have an adverse effect on our business, financial condition, results of operations, and cash flows.
The US President's Fiscal Year 2014 Budget Proposal includes provisions that would, if enacted, make significant changes to US tax laws applicable to oil and natural gas exploration and production companies. These proposed changes include, but are not limited to:
| |
• | eliminating the immediate deduction for intangible drilling and development costs; |
| |
• | eliminating the deduction from income for domestic production activities relating to oil and natural gas exploration and development; |
| |
• | repealing the percentage depletion allowance for oil and natural gas properties; |
| |
• | extending the amortization period for certain geological and geophysical expenditures; and |
| |
• | implementing certain international tax reforms. |
These proposed changes in the US tax laws, if adopted, or other similar changes that reduce or eliminate deductions currently available with respect to oil and natural gas exploration and development, could adversely affect our business, financial condition, results of operations, and cash flows.
One Stone has significant influence on our major corporate decisions, including control over some matters, and could take actions that could be adverse to other stockholders. In addition, One Stone has rights as a holder of preferred stock that are senior to, and could disadvantage, holders of our common stock.
In May 2013, we issued 19.2 million shares of Series A convertible preferred stock to an affiliate of One Stone for approximately $23.5 million. The certificate of designations governing the Series A preferred stock provides One Stone, as the holder of such stock, with certain rights relating to our business and management, including the right to appoint a specified number of members of our board of directors (currently two); the right to vote on an as-converted basis with our common stockholders on matters submitted to a stockholder vote; the right to veto certain corporate actions, including some related party transactions and changes to our capital budget; and the right to receive a cash payment providing it with a specified rate of return in the event of certain change of control transactions. As a result of the foregoing, One Stone has significant influence over us, our management, our policies and matters requiring stockholder approval. The interests of One Stone may differ from the interests of our other stockholders in some circumstances, and the ability of One Stone to influence certain of our major corporate decisions may harm the market price of our common stock by delaying, deferring or preventing transactions that are or are perceived to be in the best interest of other stockholders or by discouraging third-party investors. In addition, the Series A preferred stock is senior to our common stock in terms of the right to receive dividends and payments in the event of a liquidation. These preferences could disadvantage the holders of our common stock, and may make it more difficult for us to raise equity capital in the future.
Our interests in the United Kingdom are licenses issued by the Secretary of State and if certain drilling requirements are not met could be forfeited.
We own certain interests in the UK under licenses issued by the Secretary of State for Trade and Industry under the Petroleum Act 1988. In order to retain the interest granted by the license, MPC is required to meet certain drilling requirements. If these drilling requirements are not met or waived, the interests granted by the licenses would be forfeited.
RISKS RELATED TO OUR COMMON STOCK
The market price of our common stock may fluctuate significantly, which may result in losses for investors.
During the past several years, the stock markets in general and for oil and gas exploration and production companies in particular have experienced significant price and volume fluctuations that have often been unrelated or disproportionate to the operating results and asset values of the underlying companies. In addition, due to relatively low trading volumes for our common stock, the market price for our common stock may fluctuate significantly more than the markets as a whole. The market price of our common stock could fluctuate widely in response to a variety of factors, including factors beyond our control. These factors include:
| |
• | changes in crude oil or natural gas commodity prices; |
| |
• | our quarterly or annual operating results; |
| |
• | investment recommendations by securities analysts following our business or our industry; |
| |
• | additions or departures of key personnel; |
| |
• | changes in the business, earnings estimates, or market perceptions of comparable companies; |
| |
• | changes in industry, general market, or regional or global economic conditions; and |
| |
• | announcements of legislative or regulatory changes affecting our business or our industry. |
Fluctuations in the market price of our common stock may be significant, and may result in declines in the market price and losses for investors.
We may issue a significant number of shares of common stock under outstanding stock options, future equity awards under our 2012 Omnibus Incentive Compensation Plan, and our outstanding Series A convertible preferred stock, and common stockholders may be adversely affected by the issuance and sale of those shares.
As of June 30, 2013, we had 7,788,957 stock options outstanding, of which 7,788,957 were fully vested and exercisable, and 19,239,734 shares of Series A convertible preferred stock outstanding. In addition, on July 1, 2013, we granted a total of 450,000 and 266,664 restricted shares of common stock to executive officers and directors, respectively, under our 2012 Omnibus Incentive Compensation Plan. As of that date, there were 3,343,441 shares of common stock remaining available for future awards under that plan. If all of the outstanding stock options, which total 8,408,957 and have exercise prices ranging from $0.79 to $2.41 per share, are exercised, or the outstanding shares of Series A convertible preferred stock are converted, the shares of common stock issued would represent approximately 16% and 30%, respectively, of the outstanding common shares. Sales of those shares could adversely affect the market price of our common stock, even if our business is doing well.
If our common stock is delisted from the NASDAQ Capital Market, its liquidity and value could be reduced.
In order for us to maintain the listing of our shares of common stock on the NASDAQ Capital Market, the common stock must maintain a minimum bid price of $1.00 as set forth in NASDAQ Marketplace Rule 5550(a)(2). If the closing bid price of the common stock is below $1.00 for 30 consecutive trading days, as occurred in October-November 2012, then the closing bid price of the common stock must be $1.00 or more for 10 consecutive trading days during a 180-day grace period to regain compliance with the rule, as occurred in January 2013. On September 12, 2013, the closing market price of our common stock was $1.03 per share, but the common stock has closed at below $1.00 on certain trading days in 2013. If our common stock is delisted from trading on the NASDAQ Capital Market, it may be eligible for trading on the OTCQB, but the delisting of our common stock from NASDAQ could adversely impact the liquidity and value of our common stock.
We do not intend to pay cash dividends on our common stock in the foreseeable future, and therefore only appreciation of the price of our common stock will provide a return to our common stockholders.
Subject to the satisfaction of the dividend rights of our Series A convertible preferred stock, which provide for a dividend equivalent of 7% per annum on the issue price plus any accumulated unpaid dividends, payable in the form of cash, in kind (in the form of additional shares of Series A preferred stock), or a combination thereof (at our option), we currently anticipate that we will retain future earnings, if any, to reduce our accumulated deficit and finance the growth and development of our business. The Series A preferred stock ranks senior to the common stock with respect to dividends and other rights, and we do not intend to pay cash dividends on our common stock in the foreseeable future. Any future determination as to the declaration and payment of cash dividends on our common stock will be at the discretion of our board of directors and will depend upon our financial condition, results of operations, contractual restrictions, capital requirements, business prospects, and any other factors that our board determines to be relevant. As a result, only appreciation of the price of our common stock, which may not occur, will provide a return to our common stockholders.
Our largest stockholder beneficially owns a significant percentage of our common stock, and its interests may conflict with those of our other stockholders.
One Stone Holdings II LP owns 19,239,734 shares of our Series A convertible preferred stock, and thereby currently beneficially owns approximately 30% of our common stock, assuming full conversion of the Series A preferred stock. The Series A preferred stock is entitled to vote on an as-converted basis with the common stock. In addition, two individuals affiliated with One Stone serve on our eight-member board of directors. As a result, One Stone is able to exercise significant influence over matters requiring stockholder approval, including the election of directors, changes to our organizational documents, and significant corporate transactions. Further, for so long as One Stone owns at least 10% of the fully diluted common stock, assuming full conversion of the Series A preferred stock, One Stone will hold veto rights with respect to capital expenditures greater than $15.0 million that are not provided for in the then-current annual budget, changes in our principal line of business, an increase in the size of our board to more than 12 members, and certain other matters.
The concentration of ownership and voting power with One Stone makes it difficult for any other holder or group of holders of our common stock to be able to affect the way we are managed or the direction of our business. The interests of One Stone with respect to matters potentially or actually involving or affecting us, such as future acquisitions, financings, and other corporate opportunities, and attempts to acquire us, may conflict with the interests of our other stockholders. This continued concentration of ownership will make it difficult for another company to acquire us and for stockholders to receive any related takeover premium unless One Stone approves the acquisition.
Provisions in our charter documents and Delaware law make it more difficult to effect a change in control of our company, which could prevent stockholders from receiving a takeover premium on their investment.
We are a Delaware corporation, and the anti-takeover provisions of Delaware law impose various barriers to the ability of a third party to acquire control of us, even if a change of control would be attractive to our existing stockholders. In addition, our certificate of incorporation and by-laws contain several provisions that may make it more difficult for a third party to acquire control of us without the approval of our board of directors. These provisions may make it more difficult or expensive for a third party to acquire a majority of our outstanding common stock. Among other things, these provisions:
| |
• | authorize us to issue preferred stock that can be created and issued by the board of directors without prior stockholder approval, with rights senior to those of the common stock; |
| |
• | classify our board of directors so that only some of our directors are elected each year; |
| |
• | prohibit stockholders from calling special meetings of stockholders; and |
| |
• | establish advance notice requirements for submitting nominations for election to the board of directors and for proposing matters that can be acted upon by stockholders at a meeting. |
These provisions also may delay, prevent, or deter a merger, acquisition, tender offer, proxy contest, or other transaction that might otherwise result in our stockholders receiving a premium over the market price of their common stock.
ITEM 1B: UNRESOLVED STAFF COMMENTS
None.
ITEM 3: LEGAL PROCEEDINGS
We may be involved from time to time in legal proceedings relating to disputes or claims arising out of our operations in the normal course of business. As of the filing date of this report, there are no pending legal proceedings that we believe could have a material adverse effect on our financial condition, results of operations, or cash flows.
ITEM 4: MINE SAFETY DISCLOSURES
Not applicable.
PART II
ITEM 5: MARKET FOR REGISTRANT'S COMMON EQUITY, RELATED STOCKHOLDER MATTERS, AND ISSUER PURCHASES OF EQUITY SECURITIES
PRINCIPAL MARKET
Magellan's common stock is traded on the NASDAQ Capital Market under the symbol MPET. The below table presents the quarterly high and low intraday prices during the periods indicated.
|
| | | | |
Quarter ended | | High | | Low |
June 30, 2013 | | $1.19 | | $0.97 |
March 30, 2013 | | $1.33 | | $0.86 |
December 31, 2012 | | $1.06 | | $0.74 |
September 30, 2012 | | $1.63 | | $0.91 |
| | | | |
June 30, 2012 | | $1.39 | | $1.01 |
March 30, 2012 | | $1.49 | | $0.87 |
December 31, 2011 | | $1.24 | | $0.89 |
September 30, 2011 | | $1.89 | | $1.12 |
HOLDERS
As of September 12, 2013, the number of record holders of Magellan's common stock was 4,980 and, based upon inquiry, the number of beneficial owners was approximately 6,300.
FREQUENCY AND AMOUNT OF DIVIDENDS
Magellan has never paid a cash dividend on its common stock. The Company does not intend to pay cash dividends on its common stock in the foreseeable future.
ISSUER PURCHASES OF EQUITY SECURITIES
The table below provides information about purchases of the Company's common stock by the Company during the periods indicated.
|
| | | | | | | | | | | | | | |
Period | | Total number of shares purchased | | Average price paid per share | | Total number of shares purchased as part of publicly announced program | | Maximum value of shares that may yet be purchased under the program |
April 1, 2013 - April 30 , 2013 | | — |
| | $ | — |
| | — |
| | $ | 1,863,022 |
|
May 1, 2013 - May 31, 2013 | | — |
| | $ | — |
| | — |
| | $ | 1,863,022 |
|
June 1, 2013 - June 30, 2013 | | — |
| | $ | — |
| | — |
| | $ | 1,863,022 |
|
Total | | — |
| | $ | — |
| | — |
| | $ | 1,863,022 |
|
On September 24, 2012, the Company announced that its Board of Directors had approved a new stock repurchase program whereby the Company is authorized to repurchase up to a total of $2.0 million in shares of its common stock. This authorization supersedes the prior plan announced on December 8, 2000, and will expire on August 21, 2014. The shares may be repurchased from time to time in open market transactions or privately negotiated transactions, subject to market conditions and other factors, including compliance with securities laws. Stock repurchases may be funded with existing cash balances or internal cash flow. The stock repurchase program may be suspended or discontinued at any time.
During Fiscal year 2013, the Company repurchased 149,539 shares of its common stock under the approved stock repurchase program between November 2012 and February 2013, and 9,264,637 shares of common stock through a Collateral Agreement (see Note 9). During this period the Company's share price was below $1.00 per share. No further repurchases of the Company's common stock occurred since.
ITEM 6: SELECTED FINANCIAL DATA
The Company is a smaller reporting company, as defined by 17 CFR § 229.10(f)(1), and therefore is not required to provide the information otherwise required by this Item.
ITEM 7: MANAGEMENT'S DISCUSSION AND ANALYSIS OF FINANCIAL CONDITION AND RESULTS OF OPERATIONS
INTRODUCTION
The following discussion and analysis presents management's perspective of our business, financial condition, and overall performance. This information is intended to provide investors with an understanding of our past performance, current financial condition, and outlook for the future, and should be read in conjunction with Item 8: Financial Statements and Supplementary Data of this Form 10-K. In the following tables, the combination of Palm Valley and Mereenie (until May 2012) represents our MPA reporting segment. Amounts expressed in Australian currency are indicated as "AUD."
Forward looking statements are not guarantees of future performance, and our actual results may differ significantly from the results expressed or implied in the forward looking statements. See "Forward Looking Statements" at the end of this section. Factors that might cause such differences include, but are not limited to, those discussed in Item 1A: Risk Factors of this Form 10-K. We assume no obligation to revise or update any forward looking statements for any reason, except as required by law.
OVERVIEW OF THE COMPANY
Magellan is an independent energy company engaged in the exploration, development, production, and sale of crude oil and natural gas. Our operations are conducted through three wholly owned subsidiaries: NP, which owns and operates an oilfield in Poplar; MPA, which owns and operates onshore gas fields in Australia, and owns an offshore exploration license in Australia; and MPUK, which owns a large acreage position in the Weald and Wessex Basins in southern England. Our strategy
is to enhance shareholder value by maximizing the value of these existing assets. We accomplish this through the exploration and development of our assets as outlined in Items 1 and 2: Business and Properties of this report.
SIGNIFICANT DEVELOPMENTS IN FISCAL YEAR 2013
During fiscal year 2013, the Company took important steps in its strategy of creating value from our existing assets. Administratively, we completed the two-year turn-around of the Magellan platform through a number of achievements, including: hiring new engineering and geologic personnel, completing the overhaul of our accounting function, delisting from the Australian Securities Exchange ("ASX"), repurchasing 17% of our common shares plus warrants from an unsupportive shareholder, and raising $23.5 million in convertible preferred equity on terms the Company believes were attractive. As a result, we believe we now have an organized and effective platform poised to achieve growth and the successful development of our assets.
Operationally, we made steady progress on each of our key projects such that we can continue to achieve key developmental and operational milestones in fiscal year 2014. At Poplar, our work on the CO2-EOR pilot during fiscal year 2013 resulted in obtaining a CO2 supply contract and receiving the permits to start the drilling of our pilot wells in July and August 2013, respectively. With the drilling of CO2-EOR pilot wells now underway, we expect to deliver results by the end of calendar year 2014. In parallel, we initiated a water shut-off program to increase oil production from the existing wells at Poplar and reduce our operating costs. This program has started to yield positive results, and we will continue to implement it across the field as we gather results from each treatment. Onshore Australia, we spent most of fiscal year 2013 in discussions and contract negotiations with potential customers of Dingo gas, resulting in the signing of a long term gas sales contract, the Dingo GSPA with PWC for the sale of the majority of Dingo's reserves. Gas sales are expected to commence in early calendar year 2015 once surface facilities and a tie-in pipeline are constructed at Dingo. With gas sales contracts in place at both Palm Valley and Dingo, and considering the cost of Dingo's surface facilities and pipeline tie-in, we expect our Amadeus Basin assets to provide Magellan with reasonably predictable cash flows. Offshore Australia, we conducted 2-D and 3-D seismic surveys over NT/P82, our 100% owned exploration license in the Bonaparte Basin. Based on the preliminary interpretation of the seismic data we acquired, we are optimistic about our ability to execute a successful farmout transaction in fiscal year 2014 whereby a new partner will drill the large gas prospects that lie within our block. In the UK, together with our partner Celtique, we completed an extensive geological analysis of the potential prospects underlying our Weald Basin acreage. In addition, we prepared and filed permit applications to drill exploratory wells on our acreage, which will allow us to drill and further assess the potential for conventional and unconventional oil production in fiscal year 2014.
As a result of the achievements and improvements realized in fiscal year 2013, in fiscal year 2014 we expect to receive the results of various operational initiatives that will allow us to demonstrate the potential value of our assets and develop an asset rationalization strategy to maximize Magellan's net asset value per share.
SUMMARY RESULTS OF OPERATIONS FOR THE YEAR ENDED JUNE 30, 2013
For the year ended June 30, 2013, revenues totaled $7.1 million compared to $13.7 million in the prior year, a decrease of 48%. Operating loss totaled $22.5 million compared to operating income of $19.8 million in the prior year. Net loss totaled $19.8 million ($0.41/basic share), compared to a net income of $26.5 million ($0.49/basic share) in the prior year, primarily due to the favorable impact of the Santos SA in fiscal year 2012. Adjusted EBITDAX (see Non-GAAP Financial Measures and Reconciliation under Part 1, Items 1 and 2: Business and Properties) totaled negative $10.9 million, compared to negative $11.2 million in the prior year, a change of (2)%. For further detail, please refer to the discussion below in this section under Comparison of Financial Results and Trends Between Fiscal 2013 and 2012.
HIGHLIGHTS OF OPERATIONAL ACTIVITIES
During fiscal year 2013, the Company took important steps in its strategy of creating value from our existing assets. We made steady progress on meeting developmental and operational milestones on each of our key projects. The below discussion should be read in conjunction with the discussion of Significant Developments in Fiscal Year 2013 under Part 1, Items 1 and 2: Business and Properties above and the section covering Comparison of Financial Results and Trends between Fiscal Years 2013 and 2012 below.
Poplar (Montana, United States)
Magellan 100% operated intervals. During the year ended June 30, 2013, Magellan sold 72 Mbbls of oil attributable to its net revenue interests in Poplar, compared to 75 Mbbls of oil sold during the same period in 2012. These results represent a 4% decrease in average daily sales for the year from 205 boepd to 198 boepd.
During this period, Magellan focused heavily on advancing its CO2-EOR pilot project in the Charles formation at Poplar. The Company worked with various governmental agencies, including the Bureau of Land Management and the Bureau of Indian Affairs, to gain permits for the drilling of five wells as part of a CO2-EOR pilot project. These permits were received and drilling on these wells began in August 2013. In parallel to the permitting process, Magellan evaluated various options for the supply and transportation of CO2 for its pilot project, resulting in the signing of an approximately two-year CO2-supply contract with Air Liquide in July 2013. The CO2 supplied by Air Liquide will be trucked and stored on the drilling site and is expected
to satisfy the CO2 volume requirements to our CO2-EOR pilot project. However, the current arrangement with Air Liquide will not be sufficient for a full field CO2-EOR program.
Magellan also remained focused on increasing oil production at Poplar and reducing operating expenses by reducing associated water production. Since most of the wells at Poplar were drilled in the 1950s, we regularly have to perform various work-overs on the wells such as small acid stimulations, fixing parted rods, and tanks and flowline repairs. These work-overs, combined with the cost of handling relatively high water production, result in high fixed costs and, while oil production remains at current levels, in high LOE/bbls. In order to increase oil production and reduce operating costs, we have identified a possible solution in the form of water shut-off treatments, which seek to block off part of the water influx and allow increased oil production. We continue to monitor and evaluate the results of these treatments to determine where they are most effective and which existing wells are the most likely candidates for future treatments. On the EPU 104 well, Magellan successfully executed a water shut-off treatment in December 2012. Prior to the water shut-off treatment, this well produced approximately 5 bopd and 1,050 bwpd. Following the treatment, the EPU 104's initial production rate was approximately 80 bopd and now produces at an average rate of 28 bopd and 337 bowd. Since then, the Company has performed water shut-off treatments on the EPU 119, EPU 34-11H, and EPU 42 wells, the results of which are still under evaluation. In July 2013, we performed similar operations on EPU 55 with the greatest results to date: the EPU 55 well is currently producing approximately 134 bopd and 35% oil cut. We believe that since these results are very recent, we need more time to estimate the well production decline rate of this well. During fiscal year 2013, we have invested approximately $1.2 million in several water shut-off treatments, and we will continue to prudently manage the allocation of the Company's cash resources to such treatments.
Finally, production from the Amsden formation from the EPU 117, which was a new pool discovery in January 2012, has declined from early production of approximately 80 bopd to approximately 7 bopd. We continue to test various stimulation techniques on this well.
Deep Intervals. Under the terms of the VAALCO PSA signed in September 2011, VAALCO was obligated to drill and complete at their own expense three test wells in the deeper formations at Poplar in order to earn a 65% working interest in and operatorship of these formations. Following completion of the first test well, the EPU 120, in fiscal year 2012, VAALCO completed its second test well, the EPU 133-H, as a horizontal well targeting the Bakken/Three Forks formation in September 2012. In March 2013, VAALCO completed its third test well, the EPU 125, a vertical well targeting the Nisku formation. Although core and log analyses taken during drilling of these wells were indicative of the potential for commercial hydrocarbon production from the Deep Intervals, the three test wells, upon completion and production testing, were found to be water bearing. Based on these inconclusive results and Magellan's desire to use those well bores for further exploration and/or potential salt water disposal, Magellan renegotiated certain terms of the VAALCO PSA in December 2012. Under the revised terms, Magellan (i) became the operator; (ii) obtained a 100% working interest in and operatorship of the wellbores for the first two wells, the EPU 133-H and the EPU 120; and (iii) increased its working interest in the Deep Intervals at Poplar from 35% to 50%, except for the spacing unit associated with EPU 125, VAALCO's third test well, which Magellan will operate but in which Magellan's working interest will remain 35%.
During fiscal year 2014, Magellan may attempt to recomplete the EPU 125 well in the Nisku formation. The Nisku formation at Poplar has produced approximately 200 thousand barrels of oil from a single well between 1970 and 1990, and data collected from the EPU 120 and EPU 125 wells confirmed the potential for commercial oil production from this formation. The decision to recomplete the EPU 125 will be based on further ongoing geological analysis by the Company and available cash resources.
Australia
Palm Valley. Following the termination of the PWC Palm Valley Contract in January 2012, Magellan successfully re-contracted the remaining 23 Bcf of Palm Valley's gas reserves through the Palm Valley GSPA with Santos. The Palm Valley gas field, which is operated by MPA, produced a gross average of approximately 0.5 MMcf/d of natural gas for sale for the year ended June 30, 2013. For the same time period in the prior year, the Palm Valley gas field produced approximately 2.7 MMcf/d. Gas sales volumes at Palm Valley decreased due to the termination of the PWC Palm Valley Contract in January 2012. The average price of gas, net of royalties and prior year royalty adjustments, at Palm Valley was AUD $4.80/Mcf for the year ended June 30, 2013, compared to AUD $3.01/Mcf for the prior year.
Gas volumes during fiscal year 2013 were sold under the Palm Valley GSPA to Santos. Gas sales volumes under this contract are expected to ramp up based on currently scheduled contracts to approximately 3.3 MMcf/d by the third quarter of fiscal year 2014 and to 4.1 MMcf/d by the fourth quarter of fiscal year 2015, at which point the field will be selling at its full deliverability capacity and generating revenues of approximately AUD $8.0 million per year.
Dingo. During the fiscal year, the Company undertook marketing efforts to identify and attract long term customers for Dingo's gas resources. These efforts resulted in the signing of the Dingo GSPA with PWC in September 2013 for the supply of
31 PJ (30 Bcf) of gas over a 20-year period. In parallel to the marketing efforts, during the fiscal year Magellan completed a pre-front-end engineering and design study to evaluate the cost and logistics of installing gas treatment facilities and tying the Dingo field into the existing pipeline infrastructure near Alice Springs. This study will serve as the basis for bringing Dingo to operational capability in fiscal year 2015.
NT/P82. During fiscal year 2013, Magellan focused on conducting a seismic survey over portions of its NT/P82 Exploration Permit in the Bonaparte Basin, offshore Northern Territory, Australia. In December 2012, the Company successfully conducted, via a third-party contractor, a 2-D and 3-D seismic survey over portions of the block. The seismic recording vessel Voyager Explorer, operated by Seabird Exploration FZ-LLC, acquired a total of 76 square miles of 3-D full fold data and 65 miles of 2-D full fold data. Between January and August 2013, the seismic data was undergoing processing and interpretation, including additional processing to address the impact of fluvial channeling on the seabed. The results of the seismic surveys interpretation are expected to be received by the end of the first quarter of fiscal year 2014 and we hope will allow us to begin a farmout process during the second quarter of fiscal year 2014. Through this process, we expect to identify a partner to drill exploratory wells over the large gas prospects that may lie in the permit area in exchange for an ownership interest in and operatorship of the license. The overall cost of the seismic surveys and related processing and interpretation is estimated to total approximately AUD $3.7 million, which is under the originally estimated budget.
United Kingdom
Going forward, the Company's primary objectives in the UK are (i) to receive drilling approval for a number of different sites in order to demonstrate that, assuming the prospect for producing commercial quantities of hydrocarbons is geologically and technically viable, access to drill sites is achievable within the existing regulatory framework and current social and environmental realities; and (ii) to establish the potential of its unconventional prospects, most of which lie within the licenses co-owned with Celtique, by drilling exploratory wells and collecting cores and logs. As part of this effort, the Company plans to participate in up to three evaluation wells with Celtique, the first of which will be spud in or around the third quarter of fiscal year 2014.
Celtique Operated Licenses. PEDLs 231, 234, and 243 overlay the center portion of the Weald Basin prospect for unconventional hydrocarbon resources and are subject to "drill or drop" rules by the end of June 2014 and a 50% relinquishment requirement to the extent that drilling obligations have been met by the term of the PEDLs. During fiscal year 2013, Magellan, in conjunction with Celtique, completed extensive geological analysis of the Weald Basin and focused on securing and permitting various potential well site locations.
We and our partner, Celtique, believe that the drilling of one well located in PEDL 234 may qualify to meet our work commitments for both PEDLs 234 and 243. We expect this well will be spud in the third quarter of fiscal year 2014. In addition, we are in the process of permitting a well in PEDL 231 to fulfill our commitments for drilling in PEDL 231 and have applied for a 12-month extension to our current PEDL to allow additional time to receive planning approval. In PEDL 234, we are also awaiting final planning approval to drill a well in the center of the Weald Basin, which may spud in the fourth quarter of fiscal year 2014. The purpose of these wells is to test and evaluate the Kimmeridge Clay and Liassic formations in order to substantiate the unconventional oil production potential of our acreage and to test and evaluate the conventional potential of the Triassic formations. Under the terms of our joint operating agreement with Celtique, we are required to participate in these commitment wells to maintain our working interest in the PEDLs. We intend to participate in the drilling of these wells and expect to fund our share of the costs through either our cash reserves, the farmout of a portion of our interests, or the proceeds from other asset sales.
Northern Petroleum Operated Licenses. In the Weald and Wessex Basins, Magellan owns working interests of between 23% and 40% in five licenses operated by Northern Petroleum (PEDL 126, 155, 240, and 256 and P1916), which expire between June 2014 and January 2016. During fiscal year 2013, Magellan determined it had no further development plans with respect to the Markwells Wood-1 well (located in PEDL 126), which was drilled in fiscal year 2011, and wrote off its remaining investment in that well of approximately $2.2 million. During the same period, the Company continued to evaluate the exploration options for its most recently acquired license, P1916, which lies offshore, west of the Isle of Wight, and PEDL 240 which is onshore and contiguous to P1916 and could provide a potential drilling site for the offshore prospect. P1916 is prospective for a Wytch Farm extension play.
Magellan Operated Licenses. In the Weald Basin, Magellan owns a 100% interest in two licenses (PEDL 137 and 246), which expire in September 2013 and June 2014, respectively. During fiscal year 2013, the Company actively pursued a farm-in partner for the drilling of an exploration well on the Horse Hill prospect in PEDL 137, for which the Company has obtained planning approval from the Surrey County Council. The Horse Hill well would target conventional oil plays in the Portland Sandstone and Corrallian Limestone, which are productive in nearby oil fields and a new Triassic gas play identified on 2-D seismic data which was reprocessed by the Company. The planning approval does not allow the operator to use hydraulic fracturing technology in this well. We will evaluate the Kimmeridge Clay and Liassic formations to contribute to the appraisal
of the potential of these formations in the Weald Basin. In addition, Magellan has applied to the UK Government for a 12 month renewal of the PEDL 137 license to allow time for a farmout well to be drilled.
OTHER ITEMS
Voluntary ASX Delisting
On March 28, 2013, Magellan completed the voluntary delisting of its shares from trading on the Australian Securities Exchange ("ASX"). The Company's shares had traded on the ASX in the form of CHESS Depository Interests since Magellan's 2006 acquisition of the 45% interest it did not already own in MPA. In addition, effective April 5, 2013, Magellan converted the legal status of MPA to a proprietary company, allowing Magellan to alter the MPA board structure and eliminate related compensation expense. As a result of both initiatives, Magellan expects to realize annual savings of approximately $0.3 million.
US Federal Tax Withholdings
In connection with the Company's non-payment of required US Federal tax withholdings in the course of its 2009 acquisition of an interest in NP from White Bear and YEP I, both affiliated entities with Mr. Bogachev, a former director of Magellan, the Company estimated that it had a potential total liability of approximately $2.0 million as of June 30, 2012. As of June 30, 2013, the Company believes that this matter has been fully addressed as a result of a disclosure process with the IRS. During fiscal years ending June 30, 2012, and 2013, the Company incurred total cash expenses of $0.5 million related to this matter. The effect of this transaction on the consolidated statements of operations for the year ended June 30, 2013, resulted in other income of $0.4 million representing the difference between the original estimate and the approximate final liability of $0.1 million (see Note 13).
Transfer of MPUK
In June 2013, the Company completed the transfer of MPUK from MPA to MPC. The estimated fair value of the transfer was approximately $10.9 million. This transfer is not expected to give rise to any cash tax expenditures for the Company and will provide greater flexibility to the operation and funding of the Company's assets in the UK. As a result, the Company will now report MPUK as a third reportable segment together with NP and MPA.
CONSOLIDATED LIQUIDITY AND CAPITAL RESOURCES
Historically, we have funded our activities from cash from operations and our existing cash balance. The Company has limited capital expenditure obligations pertaining to its leases and licenses, which allow for significant flexibility in the use of its capital resources. Based on its existing cash position, the Company believes it has sufficient financial resources to fund its ongoing operations and to finance its core project at Poplar, the CO2-EOR pilot project, which we believe will further establish the full value of its assets. Furthermore, offshore Australia and in the UK, the Company owns interests in large potential projects, which require significant additional capital to reduce their inherent operational risk and increase their potential value. A possible funding strategy for these assets is to seek farm-in partners that will bear most of the costs of the next operational milestones in exchange for working interests in these assets alongside Magellan. The Company may also seek to raise debt facilities to fund some of its projects, including the construction of surface facilities and a pipeline to tie the Dingo gas field to Brewer Estate in Northern Territory, Australia. Finally, Magellan intends to explore the potential sale of certain assets which are more mature by the nature of their long term contracts and redeploy these proceeds in the Company's core assets, such as Poplar, which offer the potential to further increase the Company's net asset value per share.
Uses of Funds
Capital Expenditures Plans. At Poplar, the Company does not face significant mandatory capital expenditure requirements to maintain its acreage position. Substantially all of the leases are held by production and contain producing wells with reserves adequate to sustain multi-year production. Approximately 79% of the acreage has been unitized as a federal exploratory unit, which is held by production from any one well. Currently, Poplar contains 42 productive wells. In the Shallow Intervals, which are 100% owned and operated by the Company, discretionary capital expenditure plans over the next two years will be determined by the results of the CO2-EOR pilot project and results of water shut-off treatments. In the first half of fiscal year 2014, the Company intends to evaluate the potential of CO2-EOR in the Charles formation at Poplar by drilling a five-well pilot, including one CO2 injector well and four producing wells. Magellan expects to incur up to $20.0 million in capital costs on these wells. The four producing wells are designed to yield conventional oil production from the Charles formation in
addition to enhanced production as a result of the CO2-EOR.
In the Deep Intervals, which are operated by the Company and in which the Company has a working interest ranging between 50% to 35%, the Company does not intend to incur material capital expenditures in fiscal year 2014. Based on its cash resources and other strategic considerations, the Company may invest in re-completing a well in the Nisku formation.
At Palm Valley, the Company's interest in the field is governed by Petroleum Lease No. 3, which expires in November 2024 (and is subject to automatic renewal for another 21 years). The Company is not obligated to undertake significant mandatory capital expenditures in order to maintain its position in the lease. The Company's discretionary capital expenditure plans are primarily focused on maintaining gas production from the existing facilities in order to meet delivery obligations under its gas sales contract with Santos while maintaining a safe and efficient operation, conducted in accordance with good oil field practice.
At Dingo, the Company's interest in the field is governed by Retention License No. 2, which expires in February 2014 (and is subject to renewal for an additional 5 years). Following the signing of the Dingo GSPA in September 2013, the Company expects to incur capital expenditures of approximately $20.0 million over the next 24 months in order to install surface facilities for production and processing of gas and to build a 27 mile pipeline connecting Dingo to existing pipeline infrastructure at Brewer Estate, south of Alice Springs. The Company expects to fund these expenditures from a combination of its own cash resources and through project finance debt facilities to be secured by the Dingo and/or Palm Valley assets and future cash flows therefrom or similar debt facilities.
In the Bonaparte Basin, offshore Australia, the Company holds a 100% interest in NT/P82. Under the terms of the permit, the Company is required to drill one exploratory well on the license by the license expiration date of May 2015. Following the successful completion of seismic surveys over two prospects in the license area and the associated processing and interpretation in August 2013, the Company expects to commence a farmout process in order to identify a partner experienced in offshore exploratory drilling to drill the exploratory well on our behalf. The Company expects to incur no further capital or exploratory expenditures of its own on this license at least until the first exploration well has been drilled.
In the UK, the Company's interests are governed by various Petroleum Exploration and Development Licenses and one Seaward Production License. The majority of these licenses expire in 2014, and all are subject to "drill-or-drop" obligations (for further detail, see Operations under Part 1, Items 1 and 2: Business and Properties). In fiscal year 2014, the Company will focus on evaluating the potential of its unconventional prospects in the Weald Basin in southern England, which are contained within the license areas of PEDLs 231, 234, and 243, which the Company co-owns 50% with Celtique. The Company expects to fund its share of the cost for an evaluation well to be spud within the area of these licenses during the third quarter of fiscal year 2014, of which the cost is estimated to be approximately $4.0 million net to Magellan. Pending the results of this well, the Company may participate in a second such evaluation well within these PEDLs toward the end of fiscal year 2014 or early in fiscal year 2015. The Company may seek a farmout partner to partially fund these expenditures or use the proceeds from other asset sales.
The Company expects to incur minimal capital or exploratory expenditures on its other UK licenses in fiscal year 2014.
Contractual Obligations. The following table summarizes our obligations and commitments as of June 30, 2013, to make future payments under certain contracts, aggregated by category of contractual obligation, for specified time periods as follows:
|
| | | | | | | | | | | | | | | | | | | |
| Total | | Less than 1 year | | 1-3 years | | 3-5 years | | More than 5 years |
| (In thousands) |
Purchase obligations (1) | $ | 5,660 |
| | $ | 5,660 |
| | $ | — |
| | $ | — |
| | $ | — |
|
Asset retirement obligations | 6,879 |
| | 476 |
| | 242 |
| | — |
| | 6,161 |
|
Contingent consideration payable (2) | 3,940 |
| | — |
| | 3,940 |
| | — |
| | — |
|
Operating leases (3) | 1,055 |
| | 162 |
| | 530 |
| | 363 |
| | — |
|
Long term debt, including interest (4) | 403 |
| | 403 |
| | — |
| | — |
| | — |
|
Total | $ | 17,937 |
| | $ | 6,701 |
| | $ | 4,712 |
| | $ | 363 |
| | $ | 6,161 |
|
(1) Purchase obligations of $0.7 million and $5.0 million are attributable to certain exploration and capital expenditures related to MPA and MPUK, respectively.
(2) Assumptions for the timing of these payments are based on our reserve report and planned drilling activity.
(3) Operating lease obligations are shown net of guaranteed sublease income.
(4) Long term debt in this table includes the current portion and accrued interest of $13 thousand for the 6.25% note payable (see Note 3).
Share Repurchase Program. On September 24, 2012, the Company announced that its Board of Directors had approved a stock repurchase program whereby the Company is authorized to repurchase up to a total of $2.0 million in shares of its common stock. As of June 30, 2013, $1.9 million remained authorized for stock repurchases under this program. See Issuer Purchases of Equity Securities under Part II, Item 5 of this report for additional information.
Collateral Purchase Agreement. Following the completion of the Collateral Purchase Agreement with Sopak in January 2013, the Company's cash balances were reduced by $10.0 million.
Sources of Funds
Cash and Cash Equivalents. On a consolidated basis, the Company had approximately $32.5 million of cash and cash equivalents at June 30, 2013, compared to $41.2 million as of June 30, 2012. As of June 30, 2013, $5.3 million of the Company's consolidated cash and cash equivalents were deposited in accounts held by MPA, all of which was held in several Australian banks in time deposit accounts that have terms of 90 days or less. During fiscal year 2013, the Company repatriated approximately $24.6 million in the form of dividends from MPA to MPC at a weighted average exchange rate of 1.04:1.00. These dividends are not expected to result in any cash tax expenditures.
The Company considers cash equivalents to be short term, highly liquid investments that are both readily convertible to known amounts of cash and so near their maturity that they present insignificant risk of changes in value because of changes in interest rates.
Due to the international nature of its operations, the Company is exposed to certain legal and tax constraints in matching the capital needs of its assets and its cash resources. To the extent that the Company repatriates cash amounts from MPA to the US, the Company is potentially liable for incremental US Federal and State Income Tax, which may be reduced by the US Federal and State net operating loss and foreign tax credit carry forwards available to the Company at that time.
Existing Credit Facilities. The Company's outstanding borrowings are summarized below for the fiscal years ended:
|
| | | | | | | |
| June 30, |
| 2013 | | 2012 |
| (In thousands) |
Outstanding borrowings: | | | |
Note Payable | $ | 390 |
| | $ | 870 |
|
Line of credit | 51 |
| | 50 |
|
Total | $ | 441 |
| | $ | 920 |
|
The Company, through its wholly owned subsidiary NP, maintains its only credit facility (the "Line of Credit") with Jonah Bank of Wyoming. As of June 30, 2013, $51 thousand of the $1.0 million Line of Credit was drawn, $25 thousand secured a Line of Credit in favor of the Bureau of Land Management, and $0.9 million remained available to borrow. As of June 30, 2013, NP was in compliance with its financial covenants as set forth in the term loan agreement. The credit facility is collateralized by a first mortgage and an assignment of production from Poplar and guaranteed by the Company up to $6.0 million but not to exceed the amount of the principal owed, which was $0.4 million as of June 30, 2013. The Note Payable with Jonah Bank of Wyoming will be fully amortized by June 30, 2014.
Other Sources of Financing. In addition to its existing liquid capital resources the Company has various alternatives to fund the development of its assets. These alternatives could potentially include conventional bank debt, a reserve-based loan facility, a project finance loan facility, mezzanine financing from a bank and the alternative investment markets, equity issuances via a PIPE or secondary offering, and a partial or complete divestiture or farmout of a portion of the development program of some of the Company's assets.
Cash Flows
The following table presents the Company's cash flow information for the fiscal years ended:
|
| | | | | | | |
| June 30, |
| 2013 | | 2012 |
| (In thousands) |
Cash (used in) provided by: | | | |
Operating activities | $ | (18,030 | ) | | $ | (10,441 | ) |
Investing activities | (2,925 | ) | | 35,629 |
|
Financing activities | 12,357 |
| | (3,928 | ) |
Effect of exchange rate changes on cash and cash equivalents | (148 | ) | | (462 | ) |
Net (decrease) increase in cash and cash equivalents | $ | (8,746 | ) | | $ | 20,798 |
|
Cash used in operating activities during the year ended June 30, 2013, was $18.0 million, compared to cash used of $10.4 million in 2012. The increase in cash used in operating activities primarily resulted from a combination of a decrease in revenues of $6.6 million over the prior year and increased operational spending related to exploration of $2.0 million. The decrease in operating assets and liabilities of approximately $5.8 million was driven primarily by reduced cash receipts from sales at MPA due to the impact of the Santos SA in fiscal year 2012, in addition to increased cash payments to MPC creditors at the end of fiscal year 2013. These factors were partially offset by a decrease in lease operating expenses of $5.9 million, and a reduction in general and administrative costs (excluding stock based compensation and foreign transaction loss) of $1.0 million.
Cash used in investing activities during the year ended June 30, 2013, was $2.9 million, compared to cash provided of $35.6 million in 2012. The increase in cash used in investing activities was the result of a series of proceeds in the prior year, including $5.0 million in proceeds from the VAALCO PSA (see Note 2), the refund of a $10.9 million deposit related to the Evans Shoal Asset Sales Deed, and $26.6 million in cash proceeds from the Santos SA (see Note 2). The decrease in investing activities are represented by these non-recurring prior year proceeds and by a $6.6 million reduction in capital expenditures on our projects between fiscal year 2012 and fiscal 2013.
Cash provided by financing activities during the year ended June 30, 2013, was $12.4 million, compared to cash used of $3.9 million in 2012. The increase in cash provided by financing activities primarily resulted from net proceeds from the issuance of preferred equity to One Stone in fiscal year 2013 of $23.0 million offset by the expenditure of $10.0 million on the repurchase of shares and a warrant from Sopak in January 2013.
During the year ended June 30, 2013, the effect of changes in foreign currency exchange rates negatively impacted the translation of our AUD denominated cash and cash equivalent balances into US dollars and resulted in a decrease of $0.1 million in cash and cash equivalents, compared to a decrease of $0.5 million in 2012.
COMPARISON OF FINANCIAL RESULTS AND TRENDS BETWEEN FISCAL 2013 AND 2012
Oil and Gas Sales Volumes
The following table presents oil and gas sales volumes for the fiscal years ended:
|
| | | | | | | | | | | |
| June 30, | | | | |
| 2013 | | 2012 | | Difference | | Percent change |
Net sales by field: | | | | | | | |
Poplar (Mbbls) | 72 |
| | 75 |
| | (3 | ) | | (4 | )% |
| | | | | | | |
Palm Valley gas (MMcf) | 191 |
| | 434 |
| | (243 | ) | | (56 | )% |
Mereenie oil (Mbbls) | — |
| | 45 |
| | (45 | ) | | (100 | )% |
Total Australia sales (Mboe) | 32 |
| | 119 |
| | (87 | ) | | (73 | )% |
| | | | | | | |
Net sales by product: | | | | | | | |
Oil (Mbbls) | 72 |
| | 122 |
| | (50 | ) | | (41 | )% |
Gas (MMcf) | 191 |
| | 434 |
| | (243 | ) | | (56 | )% |
| | | | | | | |
Consolidated sales (Mboe) | 104 |
| | 194 |
| | (90 | ) | | (46 | )% |
Consolidated sales (boepd) | 285 |
| | 531 |
| | (246 | ) | | (46 | )% |
Sales volumes for the year ended June 30, 2013, totaled 104 Mboe (285 boepd), compared to 194 Mboe (531 boepd) sold in the prior year period, a decrease of 46%. This decline was primarily the result of the termination of the PWC Palm Valley Contract at Palm Valley in January 2012 and the sale of the Company's interest in Mereenie in May 2012. Sales volumes by product for the year ended June 30, 2013, were 69% oil and 31% gas, compared to 63% oil and 37% gas in the prior year, with the change due to the reduced contribution of gas sales from Palm Valley. At Poplar, volumes were negatively impacted by the temporary shut-in of various wells producing from the Charles formation in order to conduct water shut-off treatments and a decline in production from the EPU 117 well, which produces from the Amsden formation, offset by increased production from the Charles formation as the result of successful water-shut-off treatments on various wells. Gas sales volumes at Palm Valley decreased due to the termination of the PWC Palm Valley Contract in January 2012. Since May 2012, gas volumes produced at Palm Valley have been sold under the Palm Valley GSPA with Santos, under which the Company has the ability to sell up to approximately 23 Bcf of natural gas, representing the majority of what the Company believes are the field's remaining gas reserves, over the next 16 years. Based on current gas sales contracts, the Company expects that Palm Valley will be selling gas at a rate of approximately 1.3 Bcf per year by the end of fiscal year 2014 and 1.5 Bcf per year by the end of fiscal year 2015, at which point Palm Valley will be selling at its full productive capacity. At Mereenie, oil sales volumes decreased primarily due to Magellan's sale of its interests in the field in May 2012.
Oil and Gas Prices
The following table presents the average realized oil and gas prices for the fiscal years ended:
|
| | | | | | | | |
| June 30, | | | | |
| 2013 | | 2012 | | Difference | | Percent change |
Average realized price (1): | | | | | | | |
Poplar (USD/bbl) | $84.91 | | $82.66 | | $2.25 | | 3 | % |
Palm Valley (AUD/Mcf) | $4.80 | | $3.01 | | $1.79 | | 59 | % |
Mereenie oil (AUD/bbl) | $0.00 | | $132.92 | | $(132.92) | | (100 | )% |
Consolidated (USD/boe) | $68.01 | | $70.95 | | $(2.94) | | (4 | )% |
(1) Prices per bbl or per Mcf are reported net of royalties. Current period prices may be influenced by prior period royalty adjustments arising from annual royalty audits.
The average realized price for the year ended June 30, 2013, was $68.01/boe compared to $70.95/boe in the prior year period, a decrease of 4%. This decrease in price is primarily the result of the loss of contribution from sales of oil from
Mereenie, which historically enjoyed favorable pricing relative to the US. At present, the Company does not engage in any oil and gas hedging activities. Relative to the prior year period, the average realized price from oil sales at Poplar increased by 3% as a result of a decrease in its benchmark pricing (WTI) partially offset by an improved differential to the benchmark realized at the field. The average realized gas price from Palm Valley increased by 59%, which reflects the higher gas prices realized under the Palm Valley GSPA with Santos, which commenced in May 2012, compared to prices that were realized under the PWC Palm Valley Contract, which ended in January 2012.
Revenues
The following table presents revenues for the fiscal years ended:
|
| | | | | | | | | | | | | | |
| June 30, | | | | |
| 2013 | | 2012 | | Difference | | Percent change |
| (In thousands) | | | | |
Net revenue by source: | | | | | | | |
Poplar (USD) | $ | 6,131 |
| | $ | 6,172 |
| | $ | (41 | ) | | (1 | )% |
Palm Valley (USD) | 939 |
| | 1,347 |
| | (408 | ) | | (30 | )% |
Mereenie (USD) | — |
| | 6,232 |
| | (6,232 | ) | | (100 | )% |
Other (USD) | — |
| | (39 | ) | | 39 |
| | (100 | )% |
Total (USD) | $ | 7,070 |
| | $ | 13,712 |
| | $ | (6,642 | ) | | (48 | )% |
| | | | | | | |
Palm Valley (AUD) | $ | 914 |
| | $ | 1,305 |
| | $ | (391 | ) | | (30 | )% |
Mereenie (AUD) | $ | — |
| | $ | 6,037 |
| | $ | (6,037 | ) | | (100 | )% |
| | | | | | | |
Net revenues by type (USD): | | | | | | | |
Oil | $ | 6,131 |
| | $ | 12,405 |
| | $ | (6,274 | ) | | (51 | )% |
Gas | 939 |
| | 1,307 |
| | (368 | ) | | (28 | )% |
Total | $ | 7,070 |
| | $ | 13,712 |
| | $ | (6,642 | ) | | (48 | )% |
Revenues for the year ended June 30, 2013, totaled $7.1 million, compared to $13.7 million in the prior year period, a decrease of 48%. The $6.6 million decrease in revenue was the result of the termination at Palm Valley of the 25-year PWC Palm Valley Contract in January 2012 and the Company's sale of its interest in Mereenie in May 2012.
Operating and Other Expenses
The following table presents selected operating expenses for the fiscal years ended:
|
| | | | | | | | | | | | | | |
| June 30, | | | | |
| 2013 | | 2012 | | Difference | | Percent change |
| (In thousands) | | | | |
Selected operating expenses (USD): | | | | | | | |
Lease operating | $ | 7,037 |
| | $ | 12,897 |
| | $ | (5,860 | ) | | (45 | )% |
Depletion, depreciation, amortization, and accretion | $ | 1,534 |
| | $ | 1,744 |
| | $ | (210 | ) | | (12 | )% |
Exploration | $ | 8,267 |
| | $ | 6,291 |
| | $ | 1,976 |
| | 31 | % |
General and administrative | $ | 11,829 |
| | $ | 13,091 |
| | $ | (1,262 | ) | | (10 | )% |
| | | | | | | |
Selected operating expenses (USD/boe): | | | | | | | |
Lease operating | $ | 68 |
| | $ | 66 |
| | $ | 2 |
| | 3 | % |
Depletion, depreciation, amortization, and accretion | $ | 15 |
| | $ | 9 |
| | $ | 6 |
| | 67 | % |
Exploration | $ | 79 |
| | $ | 32 |
| | $ | 47 |
| | 147 | % |
General and administrative | $ | 114 |
| | $ | 67 |
| | $ | 47 |
| | 70 | % |
Lease Operating Expenses. Lease operating expenses decreased by $5.9 million to $7.0 million, or $68/boe, during the year ended June 30, 2013. Lease operating expenses at Poplar decreased by approximately $0.4 million primarily as the result of a lower average of actively producing wells and a more selective work-over program in fiscal year 2013 focused mainly on water shut-off treatments. Lease operating expenses in Australia decreased by $5.5 million primarily as a result of the Company's sale of its interest in Mereenie in May 2012, which contributed $6.0 million to lease operating expenses in the prior fiscal year.
Depletion, Depreciation, Amortization, and Accretion. The following table presents depletion, depreciation, amortization, and accretion for the fiscal years ended:
|
| | | | | | | | | | | | | | |
| June 30, | | | | |
| 2013 | | 2012 | | Difference | | Percent change |
| (In thousands) | | | | |
Depreciation and amortization | $ | 285 |
| | $ | 433 |
| | $ | (148 | ) | | (34 | )% |
Depletion | 816 |
| | 743 |
| | 73 |
| | 10 | % |
ARO accretion | 433 |
| | 568 |
| | (135 | ) | | (24 | )% |
Total | $ | 1,534 |
| | $ | 1,744 |
| | $ | (210 | ) | | (12 | )% |
Depletion, depreciation, amortization, and accretion expenses decreased by $0.2 million to $1.5 million, or $15/boe, during the year ended June 30, 2013. Accretion expense decreased as a result of the Company's sale of its interest in Mereenie in May 2012, which consequently reduced AROs.
Exploration Expenses. Exploration expenses increased by $2.0 million to $8.3 million, or $79/boe, during the year ended June 30, 2013. The $2.0 million increase is the result of a $1.7 million increase at MPA and a $1.4 million increase at MPUK, offset by a $1.1 million decrease at NP. Of the $8.3 million of exploration expenses incurred during the current period, $2.3 million related to non-cash exploration write offs, which included $2.2 million related to the Markwells Wood-1 well in the UK. The remaining $6.0 million were incurred for general and seismic exploration costs, including $3.7 million incurred for seismic activities over NT/P82 in Australia and $1.5 million for general exploration in the UK, and $300 thousand related to analysis of the planned CO2-EOR pilot project at Poplar.
General and Administrative Expenses. The following table presents general and administrative expenses for the fiscal years ended:
|
| | | | | | | | | | | | | | |
| June 30, | | | | |
| 2013 | | 2012 | | Difference | | Percent change |
| (In thousands) | | | | |
General and administrative (excluding stock based compensation and foreign transaction loss) | $ | 10,963 |
| | $ | 12,006 |
| | $ | (1,043 | ) | | (9 | )% |
Stock based compensation | 848 |
| | 1,560 |
| | (712 | ) | | (46 | )% |
Foreign transaction loss (gain) | 18 |
| | (475 | ) | | 493 |
| | (104 | )% |
Total | $ | 11,829 |
| | $ | 13,091 |
| | $ | (1,262 | ) | | (10 | )% |
General and administrative expenses decreased by $1.3 million to $11.8 million, during the year ended June 30, 2013. General and administrative expenses, excluding stock based compensation and foreign transaction losses and gains, amounted to $11.0 million, a decrease of $1.0 million. This decrease primarily resulted from a $2.2 million reduction in the use of third party accounting and legal services. These decreases in expenditures were offset by a $1.0 million increase in salaries and benefits which was primarily due to a $0.8 million expense for severance costs, and a $0.2 million increase in office administrative costs. Stock based compensation decreased to $0.8 million, largely due certain stock options granted in prior years vesting fully during the year ended June 30, 2013. Following the completion of the Santos SA in May 2012, Foreign transaction loss (gain) is expected to be minimal in the future.
OFF-BALANCE SHEET ARRANGEMENTS
The Company does not use off-balance sheet arrangements, such as securitization of receivables, with any unconsolidated entities or other parties.
CRITICAL ACCOUNTING POLICIES AND ESTIMATES
Our discussion of financial condition and results of operations is based upon the information reported in our consolidated financial statements. The preparation of these statements requires us to make certain assumptions and estimates that affect the reported amounts of assets, liabilities, revenues, and expenses as well as the disclosure of contingent assets and liabilities at the date of our financial statements. We base our assumptions and estimates on historical experience and other sources that we believe to be reasonable at the time. Actual results may differ from these estimates and assumptions used in preparation of our consolidated financial statements. We provide expanded discussion of our more significant accounting policies, estimates, and judgments made by management in Note 1 to our consolidated financial statements. We have outlined below certain more significant estimates and assumptions used in preparation of our consolidated financial statements.
Oil and Gas Properties
Successful Efforts Accounting. We account for our oil and gas operations using the successful efforts method of accounting. Under this method, all property acquisition costs and costs of exploratory and development wells are capitalized when incurred, pending determination of whether proved reserves have been discovered. If an exploratory well does not find proved reserves, the costs of drilling the well are charged to expense and included within the consolidated statement of cash flows and reported as capital expenditures under investing activities when initially incurred. The costs of development wells are capitalized whether those wells are successful or unsuccessful. The application of the successful efforts method of accounting requires managerial judgment to determine the proper classification of wells designated as developmental or exploratory, which classification will ultimately determine the proper accounting treatment of the costs incurred.
Oil and Gas Reserve Quantities. Reserve quantities and the related estimates of future net cash flows affect our periodic calculations of depletion and the assessment of impairment. As a result, adjustments to depletion and evaluation of impairment are made concurrently with changes to reserves estimates. Reserve quantities and future cash flows included in this report are prepared in accordance with guidelines established by the SEC and the Financial Accounting Standards Board (the "FASB"). Our independent third party engineering firms adhere to the same guidelines when auditing our reserve reports. The accuracy of our reserve estimates is a function of many factors including the following: the quality and quantity of available data, the interpretation of that data, the accuracy of various mandated economic assumptions, and the judgments of the individuals preparing the reserves estimates. Estimates prepared by others may be higher or lower than our estimates. Because these
estimates depend on many assumptions, all of which may differ substantially from actual results, reserve estimates may be different from the quantities of oil and gas that are ultimately recovered. As a result, material revisions to existing reserves estimates may occur from time to time. Although every reasonable effort is made to ensure that the reported reserves estimates represent the most accurate assessments possible, the subjective decisions and variances in available data for various fields make these estimates generally less precise than other estimates included in our financial statements.
Depreciation, Depletion, and Amortization. The provision for depletion of oil and gas properties is calculated on a field-by-field basis using the unit-of-production method and is dependent upon our estimates of total proved and proved developed reserves, which estimates incorporate various assumptions regarding future development and abandonment costs as well as our level of capital spending. If the estimates of total proved or proved developed reserves decline, the rate at which we record depreciation, depletion and amortization ("DD&A") expense increases, which in turn, increases DD&A expense. This decline may result from lower market prices, which may make it uneconomic to drill for and produce higher cost fields. We are unable to predict changes in reserve quantity estimates with a high level of precision as such quantities are dependent on the success of our exploitation and development program, as well as future economic conditions.
Impairment of Oil and Gas Properties. Oil and gas properties are assessed quarterly, or more frequently as economic events dictate, for potential impairment. Any impairment loss is the difference between the carrying value of the asset and its fair value. We estimate the fair value using expected future cash flows of our oil and gas properties and compare these undiscounted future cash flows to the carrying amount of the oil and gas properties to determine if the carrying amount is recoverable. If the carrying amount exceeds the estimated undiscounted future cash flows, the cost of the property is written down to fair value, which is determined using net discounted future cash flows from the producing property. Different pricing assumptions (see Note 16) or discount rates could result in a different calculated impairment.
Asset Retirement Obligation. Our asset retirement obligations ("AROs") consist primarily of estimated future costs associated with the plugging and abandonment of oil and gas properties. The discounted fair value of an ARO liability is required to be recognized in the period in which it is incurred, with the associated asset retirement cost capitalized as part of the carrying cost of the oil and gas asset. The recognition of an ARO requires that management make numerous estimates, assumptions, and judgments regarding such factors as costs to satisfy plugging and abandonment and other obligations, future advances in technology, timing of settlements, the credit-adjusted risk-free rate, and inflation rates. In periods subsequent to the initial measurement of the ARO, we must recognize period-to-period changes in the liability resulting from the passage of time and revisions to either the timing or the amount of the original estimate of undiscounted cash flows. Increases in the ARO liability due to the passage of time impact operating results as accretion expense. The related capitalized cost, net of estimated salvage values, including revisions thereto, is charged to expense through DD&A over the life of the oil and gas property.
Revenue Recognition
We record revenues from the sale of oil and gas in the month in which the delivery to the purchaser occurred and title transferred. We receive payment one to three months after delivery. At the end of each month, we estimate the amount of production delivered to purchasers and the price we will receive. Variances between our estimated revenue and actual payment are recorded in the month the payment is received. Historically, any differences have been insignificant.
Stock Based Compensation
We recognize compensation expense for all share-based payment awards made to employees and directors. Stock based compensation expense is measured at the grant date based on the fair value of the award. Judgments and estimates are made regarding, among other things, the appropriate valuation methodology to follow in valuing stock compensation awards and the related inputs required by those valuation methodologies. The Black-Scholes-Merton pricing model is used to value time based and performance based awards that do not contain performance or market conditions which impact the valuation of the award. This pricing model uses assumptions regarding expected volatility of our common stock, the risk-free interest rates, expected term of the awards, and other valuation inputs, which are subject to change. Any such changes could result in different valuations and thus impact the amount of stock based compensation expense recognized.
Costs related to time based stock options are recognized as an expense on a straight-line basis over the requisite service period, which is generally the vesting period. Performance based options are recognized over the performance period when the achievement of the performance conditions is considered probable. Management re-assesses whether satisfaction of performance conditions are probable at the end of each reporting period. As of June 30, 2013, there were no performance based options outstanding.
Income Taxes and Uncertain Tax Positions
We record deferred tax assets and liabilities to account for the expected future tax consequences of events that have been recognized in our financial statements and our tax returns. We routinely assess the realizability of our deferred tax assets. If we conclude that it is more likely than not that some portion or all of our deferred tax assets will not be realized, the tax asset is reduced by a valuation allowance. We consider future taxable income in making such assessments. Numerous judgments and assumptions are inherent in the determination of future taxable income, including factors such as future operating conditions.
Accounting guidance for recognizing and measuring uncertain tax positions prescribes a more likely than not recognition threshold that a tax position must meet for any of the benefit of the uncertain tax position to be recognized in the financial statements. Previously recognized uncertain tax positions that no longer meet the more-likely-than-not threshold should be derecognized in the first subsequent financial reporting period in which that threshold is no longer met. There are no uncertain tax positions that would meet the more-likely-than-not recognition threshold for the fiscal year ended June 30, 2013.
Foreign Currencies and Foreign Currency Adjustment of Intercompany Loans
When intercompany foreign currency transactions between entities included in the consolidated financial statements are of a long term investment nature (i.e., those for which settlement is not planned or anticipated in the foreseeable future) foreign currency translation adjustments resulting from those transactions are included in stockholders' equity as accumulated other comprehensive (loss) income. However, when intercompany transactions are deemed to be of a short term nature, translation adjustments are required to be included in the consolidated statement of operations.
As a result of the Company's repatriation of Australian held funds to the US during the first quarter of fiscal year 2013, we assessed whether all investments and intercompany transactions continues to be considered long term in nature. In the event certain transactions and/or investments are no longer considered long term in nature, any subsequent foreign currency translation adjustments associated with such items could be required to be reflected in the Company's future statements of operations. Accordingly, if foreign currency translation adjustments are required to be reported in our future statements of operations, exchange rate volatility could have a significant effect on future period results of operations.
During fiscal 2013, all investments and intercompany transactions continue to be considered long term in nature, and as a result, all foreign currency translation adjustments were recorded as a separate component of stockholders' equity as accumulated other comprehensive (loss) income.
Accounting for Business Combinations
The Company continues to pursue acquisitions as opportunities arise in order to grow our business. We have accounted for all of our business combinations to date in accordance with guidelines established by the Financial Accounting Standards Board, using the acquisition method of accounting, which involves the use of significant judgment.
In estimating the fair values of assets acquired and liabilities assumed in a business combination, we make various assumptions. The most significant assumptions relate to the estimated fair values assigned to proved and unproved crude oil and natural gas properties. We estimate future prices to apply to the estimated reserves quantities acquired, and estimate future operating and development costs, to arrive at estimates of future net cash flows. For estimated proved reserves, the future net cash flows are discounted using a market based weighted average cost of capital rate, adjusted for risk, determined to be appropriate at the time of the acquisition.
The calculation of the contingent consideration payable is a significant management estimate and is calculated using production projections and the estimated timing of production payouts. The Company also utilized a discount which is consistent with the the Company’s credit adjusted incremental borrowing rate.
Authoritative Accounting Matters
See "Recently Issued Accounting Standards" under Note 1 for additional information on the recent adoption of new authoritative accounting guidance in Part II, Item 8: Financial Statements and Supplementary Data of this Form 10-K.
MANAGEMENT ANALYSIS OF CERTAIN MARKET RISK ISSUES
The Company's exposure to market risk relates to fluctuations in foreign currency and world prices for crude oil, as well as market risk related to investment in marketable securities. The exchange rates between the Australian dollar and the US dollar, as well as the exchange rates between the US dollar and the British pound, have changed in recent periods and may
fluctuate substantially in the future. Any appreciation of the US dollar against the Australian dollar is likely to have a negative impact on our revenue, operating income, and net income. Because of our UK development program, a portion of our expenses, including exploration costs and capital and operating expenditures will continue to be denominated in British pounds. Accordingly, any material appreciation of the British pound against the US dollar could have a negative impact on our business, operating results, and financial condition.
For the twelve months ended June 30, 2013, oil sales represented approximately 69% of total oil and gas revenues. Based on fiscal year 2013 sales volume and revenues, a 10% change in oil price would increase or decrease oil revenues by $0.6 million. Gas sales, which represented approximately 31% of total oil and gas revenues in the current twelve months, are derived primarily from the Palm Valley gas field in the Northern Territory of Australia and the gas prices are set according to long term contracts that are subject to changes in the Australian Consumer Price Index for the twelve months ended June 30, 2013.
At June 30, 2013, the carrying value of cash and cash equivalents was approximately $32.5 million, which approximates the fair value.
FORWARD LOOKING STATEMENTS
Statements in this report including forecasts or projections, that are not historical in nature are intended to be, and are hereby identified as, forward looking statements for purposes of the Private Securities Litigation Reform Act of 1995. The words anticipate, assume, believe, budget, estimate, expect, forecast, initial, plan, project, will, and similar expressions are intended to identify forward looking statements. These forward looking statements about the Company and its subsidiaries appears in a number of places in this Form 10-K and may relate to statements about their businesses and prospects, planned capital expenditures, availability of liquidity and capital resources, increases or decreases in oil and gas production, the ability to enter into acceptable farmout arrangements, revenues, expenses, operating cash flows, borrowings, and other matters that involve a number of risks and uncertainties that may cause actual results to differ materially from results expressed or implied in the forward looking statements. Additionally there are risks and uncertainties such as the following: the uncertainties associated with our planned CO2-EOR program at Poplar, including uncertainties about drilling results from the recently initiated pilot project and our ability to acquire a long term CO2 supply for the program; uncertainties related to whether we will be able to realize expected gas sales volumes in Australia under the Dingo GSPA and Palm Valley GSPA, including uncertainties about the ultimate level of demand under the agreements and the timing and cost of implementing a pipeline and gas treatment facilities for the Dingo GSPA; our ability to attract and retain key personnel; the likelihood of success of a water shut-off program at Poplar Field; our limited amount of control over activities on our operational properties; our reliance on the skill and expertise of third party service providers; the inability of our vendors to meet their contractual obligations; government regulation and oversight of drilling and completion activity in the UK; the uncertain nature of oil and gas prices in the US, Australia, and the UK; uncertainties inherent in projecting future rates of production from drilling activities; the uncertainty of drilling and completion conditions and results; the availability of drilling, completion, and operating equipment and services; the results of 2-D and 3-D seismic data related to the NT/P82 interest offshore Australia; and other matters discussed in the Risk Factors section of this report. Any forward looking statements in this report should be considered with these factors in mind. The Company assumes no obligation to update any forward looking statements contained in this report, whether as a result of new information, future events or otherwise, except as required by securities laws.
Proved reserves are those quantities of oil and gas, which, by analysis of geoscience and engineering data, can be estimated with reasonable certainty to be economically producible - from a given date forward, from known reservoirs, and under existing economic conditions, operating methods, and government regulations - prior to the time at which contracts providing the right to operate expire, unless evidence indicates that renewal is reasonably certain. In this report, the Company also presents estimates of probable reserves and uses the term resources. Probable reserves are those additional reserves that are less certain to be recovered than proved reserves but which, together with proved reserves, are as likely as not to be recovered. Reserves are estimated remaining quantities of oil and gas and related substances anticipated to be economically producible, as of a given date, by application of development projects to known accumulations (subject to other conditions). Resources are quantities of oil and gas and related substances estimated to exist in naturally occurring accumulations.
Estimates of probable reserves are by their nature more uncertain than estimates of proved reserves and accordingly are subject to substantially greater risk of not actually being realized by the Company.
ITEM 7A: QUANTITATIVE AND QUALITATIVE DISCLOSURES ABOUT MARKET RISK
The Company is a smaller reporting company, as defined by 17 CFR § 229.10(f)(1), and therefore is not required to provide the information otherwise required by this Item.
ITEM 8: FINANCIAL STATEMENTS AND SUPPLEMENTARY DATA
REPORT OF INDEPENDENT REGISTERED PUBLIC ACCOUNTING FIRM
To the Board of Directors and Stockholders of
Magellan Petroleum Corporation
Denver, Colorado
We have audited the consolidated balance sheets of Magellan Petroleum Corporation and subsidiaries (the "Company") as of June 30, 2013 and 2012, and the related consolidated statements of operations, comprehensive (loss) income, stockholders' equity, and cash flows for the years ended June 30, 2013 and 2012. Magellan Petroleum Corporation's management is responsible for these consolidated financial statements. Our responsibility is to express an opinion on these consolidated financial statements based on our audits.
We conducted our audits in accordance with the standards of the Public Company Accounting Oversight Board (United States). Those standards require that we plan and perform the audits to obtain reasonable assurance about whether the consolidated financial statements are free of material misstatement. The company is not required to have, nor were we engaged to perform, an audit of its internal control over financial reporting. Our audits included consideration of internal control over financial reporting as a basis for designing audit procedures that are appropriate in the circumstances, but not for the purpose of expressing an opinion on the effectiveness of the company's internal control over financial reporting. Accordingly, we express no such opinion. An audit also includes examining, on a test basis, evidence supporting the amounts and disclosures in the consolidated financial statements, assessing the accounting principles used and significant estimates made by management, as well as evaluating the overall financial statement presentation. We believe that our audits provide a reasonable basis for our opinion.
In our opinion, the consolidated financial statements referred to above present fairly, in all material respects, the financial position of Magellan Petroleum Corporation and subsidiaries as of June 30, 2013 and 2012, and the results of their operations and their cash flows for the years ended June 30, 2013 and 2012, in conformity with accounting principles generally accepted in the United States of America.
/s/ EKS&H LLLP
Denver, Colorado
September 16, 2013
MAGELLAN PETROLEUM CORPORATION
CONSOLIDATED BALANCE SHEETS
(In thousands, except share amounts)
|
| | | | | | | |
| June 30, |
| 2013 | | 2012 |
ASSETS | | | |
CURRENT ASSETS: | | | |
Cash and cash equivalents | $ | 32,469 |
| | $ | 41,215 |
|
Accounts receivable — trade | 794 |
| | 1,152 |
|
Accounts receivable — working interest partners | 58 |
| | 231 |
|
Inventories | 555 |
| | 499 |
|
Prepaid and other assets | 1,422 |
| | 511 |
|
Total current assets | 35,298 |
| | 43,608 |
|
| | | |
PROPERTY AND EQUIPMENT, NET (SUCCESSFUL EFFORTS METHOD): | | | |
Proved oil and gas properties | 35,377 |
| | 33,927 |
|
Less accumulated depletion, depreciation, and amortization | (5,814 | ) | | (5,740 | ) |
Unproved oil and gas properties | 5,312 |
| | 7,091 |
|
Wells in progress | 923 |
| | 3,744 |
|
Land, buildings and equipment (net of accumulated depreciation of $1,810 and $2,077 as of June 30, 2013, and 2012, respectively) | 1,382 |
| | 1,422 |
|
Net property and equipment | 37,180 |
| | 40,444 |
|
| | | |
OTHER NON-CURRENT ASSETS: | | | |
Goodwill | 2,174 |
| | 2,174 |
|
Deferred income taxes | 7,217 |
| | 5,951 |
|
Other long term assets | 403 |
| | 397 |
|
Total other non-current assets | 9,794 |
| | 8,522 |
|
Total assets | $ | 82,272 |
| | $ | 92,574 |
|
| | | |
LIABILITIES AND EQUITY | | | |
CURRENT LIABILITIES: | | | |
Short term line of credit | $ | 51 |
| | $ | 50 |
|
Current portion of note payable | 390 |
| | 480 |
|
Current portion of asset retirement obligations | 476 |
| | 329 |
|
Accounts payable | 1,948 |
| | 3,672 |
|
Accrued and other liabilities | 2,757 |
| | 3,000 |
|
Accrued dividends | 202 |
| | — |
|
Total current liabilities | 5,824 |
| | 7,531 |
|
| | | |
LONG TERM LIABILITIES: | | | |
Note payable | — |
| | 390 |
|
Asset retirement obligations | 6,403 |
| | 7,455 |
|
Contingent consideration payable | 3,940 |
| | 4,072 |
|
Other long term liabilities | 163 |
| | 218 |
|
Total long term liabilities | 10,506 |
| | 12,135 |
|
|
| | | | | | | |
COMMITMENTS AND CONTINGENCIES (Note 12) |
|
| |
|
|
| | | |
PREFERRED STOCK (Note 8): | | | |
Series A convertible preferred stock (par value $0.01 per share): Issued 19,239,734 and 0 as of June 30, 2013, and 2012, respectively; liquidation preference $27,227 | 23,502 |
| | — |
|
Total preferred stock | 23,502 |
| | — |
|
| | | |
EQUITY (Note 9): | | | |
Common stock (par value $0.01 per share): Authorized 300,000,000 shares, issued, 54,057,159 and 53,835,594 as of June 30, 2013, and 2012, respectively | 540 |
| | 538 |
|
Treasury stock (at cost): 9,414,176 and 0 shares as of June 30, 2013 and 2012, respectively | (9,333 | ) | | — |
|
Capital in excess of par value | 90,786 |
| | 90,753 |
|
Accumulated deficit | (50,079 | ) | | (29,590 | ) |
Accumulated other comprehensive income | 10,526 |
| | 11,207 |
|
Total equity attributable to Magellan Petroleum Corporation | 42,440 |
| | 72,908 |
|
Total liabilities, preferred stock and equity | $ | 82,272 |
| | $ | 92,574 |
|
|
| | |
The accompanying notes are an integral part of these consolidated financial statements.
MAGELLAN PETROLEUM CORPORATION
CONSOLIDATED STATEMENTS OF OPERATIONS
(In thousands, except share and per share amounts)
|
| | | | | | | |
| For the years ended June 30, |
| 2013 | | 2012 |
REVENUES: | | | |
Oil production | $ | 6,131 |
| | $ | 12,405 |
|
Gas production | 939 |
| | 1,307 |
|
Total revenues | 7,070 |
| | 13,712 |
|
| | | |
OPERATING EXPENSES (INCOME): | | | |
Lease operating | 7,037 |
| | 12,897 |
|
Depletion, depreciation, amortization, and accretion | 1,534 |
| | 1,744 |
|
Exploration | 8,267 |
| | 6,291 |
|
General and administrative | 11,829 |
| | 13,091 |
|
Impairment | 890 |
| | 328 |
|
Gain on sale of assets | — |
| | (40,413 | ) |
Total operating expense (income) | 29,557 |
| | (6,062 | ) |
| | | |
(LOSS) INCOME FROM OPERATIONS | (22,487 | ) | | 19,774 |
|
| | | |
OTHER INCOME: | | | |
Net interest income | 624 |
| | 749 |
|
Other income | 830 |
| | 9 |
|
Total other income | 1,454 |
| | 758 |
|
| | | |
(LOSS) INCOME BEFORE INCOME TAX | (21,033 | ) | | 20,532 |
|
Income tax benefit | 1,266 |
| | 5,951 |
|
(LOSS) INCOME AFTER INCOME TAX | (19,767 | ) | | 26,483 |
|
Net loss attributable to non-controlling interest in subsidiaries | — |
| | 15 |
|
NET (LOSS) INCOME APPLICABLE TO MAGELLAN PETROLEUM CORPORATION | (19,767 | ) | | 26,498 |
|
Preferred stock dividend and accretion of preferred stock | (722 | ) | | — |
|
NET (LOSS) INCOME ATTRIBUTABLE TO COMMON STOCKHOLDERS | $ | (20,489 | ) | | $ | 26,498 |
|
| | | |
(Loss) Earnings per common share (Note 10): | | | |
Weighted average number of basic shares outstanding | 49,642,083 |
| | 53,592,958 |
|
Weighted average number of diluted shares outstanding | 49,642,083 |
| | 54,041,227 |
|
| | | |
Net (loss) income per basic share outstanding | $(0.41) | | $0.49 |
Net (loss) income per diluted share outstanding | $(0.41) | | $0.49 |
The accompanying notes are an integral part of these consolidated financial statements.
MAGELLAN PETROLEUM CORPORATION
CONSOLIDATED STATEMENTS OF COMPREHENSIVE (LOSS) INCOME
(In thousands)
|
| | | | | | | |
| For the years ended June 30, |
| 2013 | | 2012 |
| | | |
(LOSS) INCOME AFTER INCOME TAX | $ | (19,767 | ) | | $ | 26,483 |
|
Foreign currency translation adjustments | (569 | ) | | (1,180 | ) |
Unrealized holding losses on securities available for sale, net of deferred tax of $0 | (112 | ) | | (83 | ) |
TOTAL COMPREHENSIVE (LOSS) INCOME | (20,448 | ) | | 25,220 |
|
Net loss attributable to non-controlling interest in subsidiary | — |
| | 15 |
|
COMPREHENSIVE (LOSS) INCOME ATTRIBUTABLE TO MAGELLAN PETROLEUM CORPORATION | $ | (20,448 | ) | | $ | 25,235 |
|
The accompanying notes are an integral part of these consolidated financial statements.
MAGELLAN PETROLEUM CORPORATION
CONSOLIDATED STATEMENTS OF STOCKHOLDERS' EQUITY
(In thousands, except share and per share amounts)
|
| | | | | | | | | | | | | | | | | | | | | | | | | | | | | | |
| Common Stock | | Capital in Excess of Par Value | | Treasury Stock | | Accumulated Deficit | | Accumulated Other Comprehensive Income | | Non-Controlling Interest | | Total Stockholders' Equity |
| Shares | | Amount | | | | | | |
June 30, 2011 | 52,455,977 |
| | $ | 525 |
| | $ | 93,617 |
| | $ | — |
| | $ | (56,073 | ) | | $ | 12,470 |
| | $ | 1,989 |
| | $ | 52,528 |
|
Net income | — |
| | — |
| | — |
| | — |
| | 26,498 |
| | — |
| | (15 | ) | | 26,483 |
|
Foreign currency translation adjustments | — |
| | — |
| | — |
| | — |
| | — |
| | (1,180 | ) | | — |
| | (1,180 | ) |
Unrealized holding loss on securities available for sale, net of taxes | — |
| | — |
| | — |
| | — |
| | — |
| | (83 | ) | | — |
| | (83 | ) |
Stock and stock based compensation | 175,000 |
| | 2 |
| | 1,558 |
| | — |
| | — |
| | — |
| | — |
| | 1,560 |
|
Stock options exercised | 21,875 |
| | — |
| | 35 |
| | — |
| | — |
| | — |
| | — |
| | 35 |
|
Acquisition of non-controlling interest | 927,352 |
| | 9 |
| | (4,844 | ) | | — |
| | (15 | ) | | — |
| | (1,974 | ) | | (6,824 | ) |
Acquisition of working interest | 255,390 |
| | 2 |
| | 387 |
| | — |
| | — |
| | — |
| | — |
| | 389 |
|
June 30, 2012 | 53,835,594 |
| | 538 |
| | 90,753 |
| | — |
| | (29,590 | ) | | 11,207 |
| | — |
| | 72,908 |
|
Net loss | — |
| | — |
| | — |
| | | | (19,767 | ) | | — |
| | — |
| | (19,767 | ) |
Foreign currency translation adjustments | — |
| | — |
| | — |
| | — |
| | — |
| | (569 | ) | | — |
| | (569 | ) |
Unrealized holding loss on securities available for sale, net of taxes | — |
| | — |
| | — |
| | — |
| | — |
| | (112 | ) | | — |
| | (112 | ) |
Stock and stock based compensation | 221,565 |
| | 2 |
| | 846 |
| | — |
| | — |
| | — |
| | — |
| | 848 |
|
Common stock repurchased | — |
| | — |
| | — |
| | (9,333 | ) | | — |
| | — |
| | — |
| | (9,333 | ) |
Warrants repurchased and retired | — |
| | — |
| | (813 | ) | | — |
| | — |
| | — |
| | — |
| | (813 | ) |
Preferred stock accretion to fair value | — |
| | — |
| | — |
| | — |
| | (520 | ) | | — |
| | — |
| | (520 | ) |
Preferred stock dividend | — |
| | — |
| | — |
| | — |
| | (202 | ) | | — |
| | — |
| | (202 | ) |
June 30, 2013 | 54,057,159 |
| | $ | 540 |
| | $ | 90,786 |
| | $ | (9,333 | ) | | $ | (50,079 | ) | | $ | 10,526 |
| | $ | — |
| | $ | 42,440 |
|
The accompanying notes are an integral part of these consolidated financial statements.
MAGELLAN PETROLEUM CORPORATION
CONSOLIDATED STATEMENTS OF CASH FLOWS
(In thousands)
|
| | | | | | | |
| For the years ended June 30, |
| 2013 | | 2012 |
OPERATING ACTIVITIES: | | | |
(LOSS) INCOME AFTER INCOME TAX | $ | (19,767 | ) | | $ | 26,483 |
|
Adjustments to reconcile net loss to net cash used in operating activities: | | | |
Foreign transaction loss (gain) | 18 |
| | (1,038 | ) |
Depletion, depreciation, amortization, and accretion | 1,534 |
| | 1,744 |
|
Interest earned on restricted deposits | — |
| | (24 | ) |
Fair value decrease of contingent consideration payable | (132 | ) | | (79 | ) |
Deferred income taxes | (1,266 | ) | | (5,951 | ) |
Gain on disposal of assets | — |
| | (40,413 | ) |
Exploration costs previously capitalized | 2,299 |
| | 2,930 |
|
Stock based compensation | 848 |
| | 1,560 |
|
Related party withholding tax (Note 13) | — |
| | 1,082 |
|
Impairment loss | 890 |
| | 328 |
|
Severance benefit costs | 418 |
| | — |
|
Net changes in operating assets and liabilities: | | | |
Accounts receivable | 401 |
| | 3,021 |
|
Inventories | (47 | ) | | 142 |
|
Prepayments and other current assets | 80 |
| | (36 | ) |
Accounts payable and accrued liabilities | (3,255 | ) | | (138 | ) |
Other long term liabilities | (51 | ) | | (113 | ) |
Income taxes payable | — |
| | 61 |
|
Net cash used in operating activities | (18,030 | ) | | (10,441 | ) |
| | | |
INVESTING ACTIVITIES: | | | |
Additions to property and equipment | (2,925 | ) | | (9,577 | ) |
Proceeds from sale of assets | — |
| | 35,089 |
|
Purchase of working interest in Poplar | — |
| | (823 | ) |
Refund of deposit for purchase of Evans shoal (includes interest) | — |
| | 10,940 |
|
Net cash (used in) provided by investing activities | (2,925 | ) | | 35,629 |
|
| | | |
FINANCING ACTIVITIES: | | | |
Proceeds from issuance of stock | — |
| | 35 |
|
Repurchase of common stock | (9,333 | ) | | — |
|
Repurchase of warrant | (813 | ) | | — |
|
Proceeds from issuance of preferred stock, net of $520 issuance cost | 22,982 |
| | — |
|
Short term debt issuances | 2,000 |
| | 6,075 |
|
Short term debt repayments | (1,999 | ) | | (6,025 | ) |
Purchase of non-controlling interest - Nautilus Poplar LLC | — |
| | (3,461 | ) |
Long term debt repayments | (480 | ) | | (552 | ) |
Net cash provided by (used in) financing activities | 12,357 |
| | (3,928 | ) |
| | | |
| | | |
|
| | | | | | | |
| | | |
Effect of exchange rate changes on cash and cash equivalents | (148 | ) | | (462 | ) |
Net (decrease) increase in cash and cash equivalents | (8,746 | ) | | 20,798 |
|
Cash and cash equivalents at beginning of period | 41,215 |
| | 20,417 |
|
CASH AND CASH EQUIVALENTS AT END OF PERIOD | $ | 32,469 |
| | $ | 41,215 |
|
| | | |
Cash payments (receipts): | | | |
Interest paid | $ | 63 |
| | $ | 109 |
|
| | | |
Supplemental schedule of non-cash investing and financing activities: | | | |
Unrealized holding loss | $ | (112 | ) | | $ | (83 | ) |
Revision to estimate of asset retirement obligation | $ | (758 | ) | | $ | (603 | ) |
Asset retirement obligation assumed | $ | 3 |
| | $ | 3,035 |
|
Accounts payable related to capital expenditure | $ | 81 |
| | $ | 155 |
|
Accrued preferred stock dividends | $ | 202 |
| | $ | — |
|
Accretion of preferred stock to fair value | $ | 520 |
| | $ | — |
|
Amounts in accrued and other liabilities related to Sopak (See Note 13) | $ | 1,000 |
| | $ | — |
|
Amounts in prepaid and other assets related to Sopak (See Note 13) | $ | 1,000 |
| | $ | — |
|
Purchase of non-controlling interest for stock and contingent consideration | $ | — |
| | $ | 4,729 |
|
Purchase of 3% working interest for stock and contingent consideration | $ | — |
| | $ | 1,243 |
|
The accompanying notes are an integral part of these consolidated financial statements.
MAGELLAN PETROLEUM CORPORATION
NOTES TO CONSOLIDATED FINANCIAL STATEMENTS
Note 1 - Basis of Presentation
Description of Operations
Magellan Petroleum Corporation (the "Company" or "Magellan" or "we" or "us") is an independent energy company engaged in the exploration, development, production, and sale of crude oil and natural gas. The Company conducts its operations through three wholly owned subsidiaries: Nautilus Poplar LLC ("NP"), which owns and operates an oil field covering the Poplar Dome ("Poplar") located in the Williston Basin in eastern Montana; Magellan Petroleum Australia Pty Ltd ("MPA"), which owns and operates gas fields in Australia; and Magellan Petroleum (UK) Limited ("MPUK"), which owns a large acreage position in the Weald and Wessex Basins in southern England for conventional and unconventional oil and gas production.
Basis of Presentation
The accompanying consolidated financial statements include the accounts of Magellan and its wholly owned subsidiaries, NP, MPA and MPUK, and have been prepared in accordance with accounting principles generally accepted in the United States ("GAAP") and the instructions to Form 10-K and Regulation S-X published by the US Securities and Exchange Commission (the "SEC"). All intercompany accounts and transactions have been eliminated. Certain prior year amounts have been reclassified to conform to the current year presentation. Such reclassifications had no effect on the prior year net income, accumulated deficit, net assets or total shareholders' equity. The Company has evaluated events or transactions through the date of issuance of this report in conjunction with the preparation of these consolidated financial statements. All amounts presented are in US dollars, unless otherwise noted. Amounts expressed in Australian currency are indicated as "AUD."
Use of Estimates
The preparation of consolidated financial statements in conformity with GAAP requires management to make estimates and assumptions that affect the reported amounts of oil and gas reserves, assets and liabilities, disclosure of contingent assets and liabilities at the date of the consolidated financial statements, and the reported amounts of revenues and expenses during the reporting period. Actual results could differ from those estimates.
Foreign Currency Translation
The functional currency of our foreign subsidiaries is their local currency. Assets and liabilities of foreign subsidiaries are translated to US dollars at period-end exchange rates, and our consolidated statements of operations and cash flows are translated at average exchange rates during the reporting period. Resulting translation adjustments are recorded as a separate component of stockholders' equity as accumulated other comprehensive (loss) income.
Transactions denominated in currencies other than the local currency are recorded based on exchange rates at the time such transactions arise. Subsequent changes in exchange rates result in foreign currency transaction gains and losses that are reflected in results of operations as unrealized (based on period end translation) or realized (upon settlement of the transactions) and reported under general and administrative expenses in the consolidated statements of operations.
Cash and Cash Equivalents and Concentration of Credit Risk
The Company considers all highly liquid short term investments with original maturities of three months or less at the date of acquisition to be cash equivalents. The carrying value of cash and cash equivalents approximates fair value due to the short term nature of these instruments.
The Company's financial instruments exposed to concentrations of credit risk consist primarily of cash and cash equivalents. Cash and cash equivalents are held in several Australian banks in time deposit accounts that have terms of 90 days or less. The Company regularly assesses the level of credit risk we are exposed to and whether there are better ways of managing credit risk. The Company invests its cash and cash equivalents with reputable financial institutions. At times, balances deposited may exceed FDIC insured limits. The Company has not incurred any losses related to these deposits.
Accounts Receivable
Trade accounts receivable consist mainly of receivables from oil and gas purchasers. For receivables from working interest partners, the Company typically has the ability to withhold future revenue disbursements to recover non-payment of joint interest billings. Generally, oil and gas receivables are collected within two months. The collectability of accounts receivable is continuously monitored and analyzed based upon historical experience. The use of judgment is required to establish a provision for allowance for doubtful accounts for specific customer collection issues identified. The allowance for doubtful accounts were $0 as of June 30, 2013, and 2012, respectively.
Inventories
Our inventories consist of oil and gas drilling or repair items such as tubing, casing, chemicals, operating supplies, ordinary maintenance materials, and parts and production equipment for use in future drilling operations or repair operations. All inventories are carried at the lower of cost or net realizable value.
Oil and Gas Exploration and Production Activities
The Company follows the successful efforts method of accounting for its oil and gas exploration and production activities. Under this method, all property acquisition costs and costs of exploratory and development wells are capitalized until a determination is made that the well has found proved reserves or is deemed noncommercial. If a well is deemed to be noncommercial, the well costs are charged to exploration expense as dry hole cost. Exploration expenses include dry hole costs, geological and geophysical expenses, and the costs of carrying and retaining unproved properties.
Depreciation, depletion, and amortization ("DD&A") of capitalized costs related to proved oil and gas properties is calculated on a property-by-property basis using the units-of-production method based upon proved reserves. The computation of DD&A takes into consideration restoration, dismantlement, and abandonment costs as well as the anticipated proceeds from salvaging equipment. The Company records its proportionate share in joint venture operations in the respective classifications of assets, liabilities, and expenses.
The sale of a partial interest in a proved oil and gas property is accounted for as normal retirement, and no gain or loss is recognized as long as the treatment does not significantly affect the units-of-production depletion rate. A gain or loss is recognized for all other sales of producing properties and is included in the accompanying consolidated statements of operations.
The Company reviews its proved oil and gas properties for impairment whenever events and circumstances indicate that a decline in the recoverability of their carrying value may have occurred. The Company estimates the expected undiscounted future cash flows of its oil and gas properties and compares such undiscounted future cash flows to the carrying amount of the oil and gas properties to determine if the carrying amount is recoverable. If the carrying amount exceeds the estimated undiscounted future cash flows, the Company will adjust the carrying amount of the oil and gas properties to fair value. The factors used to determine fair value include, but are not limited to, recent sales prices of comparable properties, the present value of estimated future cash flows, net of estimated operating and development costs, using estimates of reserves, future commodity pricing, future production estimates, anticipated capital expenditures, and various discount rates commensurate with the risk and current market conditions associated with realizing the expected cash flows projected.
Land, Buildings, and Equipment
Land, buildings, and equipment are recorded at cost. Costs of renewals and improvements that substantially extend the useful lives of the assets are capitalized. Maintenance and repair costs are expensed when incurred. Depreciation is calculated using the straight-line method over the estimated useful lives of the assets which range from three to fifteen years.
Securities Available for Sale
Securities available for sale are comprised of investments in publicly traded securities and are carried at quoted market prices and included in the consolidated balance sheets under prepaid and other assets. Unrealized gains and losses are excluded from earnings and recorded as a component of accumulated other comprehensive (loss) income in shareholders' equity, net of deferred income taxes, until realized.
Goodwill
Goodwill represents the excess of the purchase price over the estimated fair value of the assets acquired net of the fair value of liabilities assumed in an acquisition. GAAP requires goodwill to be evaluated on an annual basis for impairment, or more frequently if events occur or circumstances change that could potentially result in impairment. We adopted the new guidance for our annual impairment test during fiscal year 2012 as allowed by ASU No. 2011-08, and therefore an assessment of qualitative factors for our annual impairment test is now performed.
A triggering event occurred in fiscal 2013 which required the Company to test its Goodwill for impairment. See Note 1 - Basis of Presentation, for additional information regarding the Company's realignment of its reporting segments. As of June 30, 2013 and 2012, management concluded that there is no impairment of goodwill. The qualitative factors used in our assessment include macroeconomic conditions, industry and market conditions, cost factors, and overall financial performance.
Historical goodwill in the amount of $0.7 million relates to the acquisition of a majority ownership stake in NP, and $4.0 million relates to the acquisition of an additional ownership interest in MPA. The decrease in goodwill during fiscal 2012 relates to the disposition of a portion of the MPA reporting segment associated with the Santos SA (see Note 2).
As of June 30, 2013, $0.7 million of recorded goodwill related to NP, $1.3 million related to MPA, and $0.2 million related to MPUK. Changes in goodwill can be summarized as follows for the years ended:
|
| | | | | | | |
| June 30, |
| 2013 | | 2012 |
| (In thousands) |
Fiscal year opening balance | $ | 2,174 |
| | $ | 4,695 |
|
Sale of Mereenie interests (see Note 2) | — |
| | 2,521 |
|
Fiscal year closing balance | $ | 2,174 |
| | $ | 2,174 |
|
Asset Retirement Obligations
The Company recognizes an estimated liability for future costs associated with the plugging and abandonment of its oil and gas properties. A liability for the fair value of an asset retirement obligation and corresponding increase in the carrying value of the related long-lived asset are recorded at the time a well is acquired or the liability to plug is legally incurred. The increase in carrying value is included in proved oil and gas properties in the accompanying consolidated balance sheets. The Company depletes the amount added to proved oil and gas property costs, net of estimated salvage values, and recognizes expense in connection with the accretion of the discounted liability over the remaining estimated economic lives of the respective oil and gas properties (see Note 4).
Revenue Recognition
The Company derives revenue primarily from the sale of produced oil and gas. Oil and gas revenues are recognized when production is sold to a purchaser at a fixed or determinable price, when delivery has occurred and title has transferred, and collectability of the revenue is probable. Transportation costs are included in production costs.
Major Customers
For our NP reporting segment, revenue from a single customer accounted for approximately 87%, and 45% of the Company's consolidated oil and gas production revenue for the years ended June 30, 2013, and 2012, respectively. For our MPA reporting segment, revenue from one customer accounted for approximately 13% and 0%, and revenue from a second customer accounted for approximately 0%, and 45% of consolidated oil and gas production revenue for the years ended June 30, 2013, and 2012, respectively.
Preferred Stock
The Company has 50.0 million shares of preferred stock authorized, par value $0.01 per share, issuable from time to time in one or more series at the discretion of the Company's Board of Directors. As of June 30, 2013, 19,239,734 shares of preferred stock were issued and outstanding.
Stock Based Compensation
Stock option grants may contain both time based or performance based vesting provisions. The time based options are expensed on a straight-line basis over the vesting period. Performance based options ("PBOs") are recognized when the achievement of the performance conditions are considered probable. Accordingly, the Company recognizes stock based compensation expense on PBOs over the period of time the performance condition is expected to be achieved. Management re-assesses whether achievement of performance conditions is probable at the end of each reporting period. If changes in the estimated outcome of the performance conditions affect the quantity of the awards expected to vest, the cumulative effect of the change is recognized in the period of change.
The Company estimates the fair value of PBOs and time based stock options using the Black-Scholes-Merton pricing model. The fair value of the stock options is determined on the grant date and is affected by our stock price and other assumptions regarding a number of complex and subjective variables. These variables include our expected stock price volatility over the term of the awards, risk free interest rates, expected dividends, and the expected option exercise term. The Company uses the simplified method to estimate the expected term of stock options due to a lack of related historical data of exercise, cancellation and forfeiture rates.
Accounting for Income Taxes
The Company follows the liability method in accounting for income taxes. Under this method, deferred tax assets and liabilities are determined based on differences between the financial reporting and tax bases of assets and liabilities and are measured using the enacted tax rates and laws that will be in effect when the differences are expected to reverse. The Company records a valuation allowance for deferred tax assets when it is more likely than not that such assets will not be recovered.
GAAP prescribes a comprehensive model for recognizing, measuring, presenting, and disclosing in the financial statements uncertain tax positions that the Company has taken or expects to take in its tax returns. Under GAAP, the Company recognizes tax positions when it is more likely than not that a tax position will be sustained upon examination, including resolution of any related appeals or litigation processes, based on the technical merits of the position. In evaluating whether a tax position has met the more-likely-than-not recognition threshold, the Company has presumed that its positions will be examined by the appropriate taxing authority that has full knowledge of all relevant information. The next step consists of measurement. A tax position that meets the more-likely-than-not recognition threshold is measured to determine the amount of benefit to recognize in the financial statements. A tax position is measured at the largest amount of benefit that has a greater than 50% likelihood of being realized upon ultimate settlement. An uncertain income tax position will not be recognized if it does not meet the more-likely-than-not threshold. To appropriately account for income tax matters, the Company is required to make significant judgments and estimates regarding the recoverability of deferred tax assets, the likelihood of the outcome of examinations of tax positions that may or may not be currently under review, and potential scenarios involving settlements of such matters. Changes in these estimates could materially impact the consolidated financial statements. There are no uncertain tax positions that would meet the more-likely-than-not recognition threshold for the fiscal years ended June 30, 2013, or 2012.
The Company has adopted an accounting policy to record all tax related interest under the interest expense and tax related penalties under general and administrative expense in the consolidated statement of operations.
Financial Instruments
The carrying value for cash and cash equivalents, accounts receivable, accounts payable, and debt approximates fair value based on the timing of the anticipated cash flows and current market conditions.
Business Combinations
The Company applies the acquisition method of recording business combinations. Under this method, the Company recognizes and measures the identifiable assets acquired from, the liabilities assumed from, and any non-controlling interest in the acquiree. Any goodwill or gain is identified and recorded. We engage independent valuation consultants to assist us in determining the fair values of crude oil and natural gas properties acquired and other third party specialists as needed to assist us in assessing the fair value of other assets and liabilities assumed. These valuations require management to make significant estimates and assumptions, especially with respect to the oil and gas properties.
The fair value of the contingent consideration payable is calculated using production projections and the estimated timing of production payouts. The Company also utilized a discount which is consistent with the the Company’s credit adjusted incremental borrowing rate.
Segment Information
During the quarter ended June 30, 2013, the Company completed a corporate restructuring of its wholly owned subsidiary in the UK whereby the equity interest in MPUK was transferred from MPA to MPC. The Company benefits from this improved structure through (i) simplified accounting and the elimination of administrative redundancies, (ii) enhanced communication and clarity for investors, and (iii) increased flexibility in the structuring of investment and operating decisions. This realignment in corporate structure required the Company to re-evaluate its reportable segments under Financial Accounting Standards Board (the "FASB") ASC Topic 280, Segment Reporting. As of June 30, 2013, the Company determined, based on the criteria of FASB ASC Topic 280, it operates in three segments, NP, MPA and MPUK, as well as a head office, Magellan ("Corporate"), which is treated as a cost center. As of June 30, 2013, these three operating segments met the minimum quantitative threshold to qualify for separate segment reporting. As of June 30, 2012, MPUK did not meet the criteria as a separate reporting segment under FASB ASC Topic 280.
The Company's chief operating decision maker is J. Thomas Wilson (President and CEO of the Company), who reviews the results and manages operations of the Company in the three reporting segments being NP, MPA, and MPUK. The presentation of all historical segment information herein has been changed to conform to this segment reporting structure, which also reflects the manner in which the Company's management monitors performance and allocates resources. For information pertaining to our reporting segments, see Note 11 - Segment Information.
(Loss) Earnings per Common Share
Income and losses per common share are based upon the weighted average number of common and common equivalent shares outstanding during the period. The effect of potential dilutive securities in the determinations of diluted earnings per share are the dilutive effect of stock options, non-vested restricted stock, and the shares of Series A convertible preferred stock. The potential dilutive impact of stock options, and non-vested restricted stock is determined using the treasury stock method. The potential dilutive impact of the shares of Series A convertible preferred stock is determined using the "if-converted" method. In applying the if-converted method, conversion is not assumed for purposes of computing dilutive shares if the effect would be antidilutive. The preferred stock is convertible at a rate of one common share to one preferred share. We did not include any stock options or common stock issuable upon the conversion of the Series A convertible preferred stock in the calculation of diluted (loss) earnings per share during the fiscal year ended June 30, 2013, as they would be antidilutive.
Accumulated Other Comprehensive (Loss) Income
Comprehensive (loss) income is presented net of income taxes in the accompanying consolidated statements of stockholders' equity and comprehensive (loss) income. Other comprehensive (loss) income is comprised of revenues, expenses, gains, and losses that under GAAP are reported as separate components of stockholders' equity instead of net (loss) income.
Recently Issued Accounting Standards
In May 2011, the FASB issued Accounting Standards Update ("ASU") No. 2011-04, which improves comparability of fair value measurements presented and disclosed in financial statements prepared in accordance with GAAP and International Financial Reporting Standards and clarifies the application of existing fair value measurement requirements including (i) the application of the highest and best use and valuation premise concepts, (ii) measuring the fair value of an instrument classified in a reporting entity's shareholders' equity, and (iii) quantitative information required for fair value measurements categorized within Level 3. ASU No. 2011-04 also provides guidance on measuring the fair value of financial instruments managed within a portfolio and application of premiums and discounts in a fair value measurement. In addition, ASU No. 2011-04 requires additional disclosure for Level 3 measurements regarding the sensitivity of fair value to changes in unobservable inputs and any interrelationships between those inputs. This guidance is effective prospectively for interim and annual periods beginning after December 15, 2011. The Company adopted this standard on July 1, 2012. The adoption of this standard did not have a material effect on the Company's financial statements.
In February 2013, the FASB issued ASU No. 2013-02, which requires an entity to report the effect of significant reclassifications out of accumulated other comprehensive income on the respective line items in net income if the amount being reclassified is required to be reclassified in its entirety to net income. For other amounts that are not required to be reclassified in their entirety to net income in the same reporting period, an entity is required to cross-reference other disclosures that provide additional detail about those amounts. ASU No. 2013-02 does not change the current requirements for reporting net income or other comprehensive income in financial statements. This guidance is effective prospectively for interim and annual
periods beginning after December 15, 2012. The Company adopted this standard on July 1, 2012. The adoption of this standard did not have a material effect on the Company's financial statements.
There are no new significant accounting standards applicable to the Company that have been issued but not yet adopted by the Company as of June 30, 2013.
Note 2 - Acquisitions and Divestitures
Evans Shoal Agreement. During the year ended June 30, 2010, MPA entered into an agreement with Santos Offshore Pty Ltd to purchase their 40% interest in the Evans Shoal natural gas field (NT/P48). On July 22, 2011, this agreement was terminated, and MPA received a deposit refund of AUD $10.0 million plus interest, pursuant to the terms of the agreement.
Sale Agreement between Magellan Petroleum (N.T.) Pty Ltd and Santos QNT Pty Ltd and Santos Limited. On May 25, 2012, Magellan Petroleum (N.T.) Pty Ltd ("Magellan NT"), a wholly owned subsidiary of MPA, Santos QNT Pty Ltd ("Santos QNT"), and Santos Limited (collectively "Santos") completed a Sale Agreement (the "Santos SA"), referred to herein as the "Santos Transaction" and became the sole owner of the Palm Valley Interests (as defined below) and of the Dingo Interests (as defined below), while Santos became the sole owner of the Mereenie Interests (as defined below). In accordance with the terms of the Santos SA, the Santos Transaction is deemed to be effective as of July 1, 2011. The Santos SA resulted in net cash proceeds of $26.6 million, including adjustments of $1.1 million, and a gain on sale of assets in the amount of $36.2 million. The Santos SA provided for the transfer of the following assets:
| |
• | Magellan NT's 35% interest in each of the Mereenie Operating Joint Venture and the Mereenie Pipeline Joint Venture (collectively, the "Mereenie Interests") to Santos QNT; |
| |
• | Santos' combined interests of 48% in the Palm Valley Joint Venture ("Palm Valley Interests") and combined interests of 66% in the Dingo Joint Venture ("Dingo Interests") to Magellan NT. |
Pursuant to the Santos SA, Magellan NT is also entitled to a series of contingent payments to be paid based on production levels at Mereenie achieved subsequent to the Santos Transaction. The maximum cumulative proceeds of the series of contingent payments is A$17.5 million. The Company has not recognized a contingent asset related to the series of contingent payments, as such amounts are not reasonably assured. The Company accounted for the Santos SA using the relative fair value method of accounting, which allocates the fair value of the assets received in the asset transfer to the Palm Valley Interests and the Dingo Interests. No goodwill or other intangible assets were recorded as a result of the Santos SA. However, goodwill in the amount of $2.5 million was allocated to the group of assets sold and recorded as a component of the gain on sale of assets. The purchase price allocation was considered final as of June 30, 2012 and the Santos SA was deemed to be effective as of July 1, 2011.
The following table summarizes the allocation of the consideration received for the assets transferred as a result of the Santos SA as of June 30, 2012.
|
| | | |
| Total |
| (In thousands) |
Consideration received: | |
Net purchase price per Santos SA | $ | 25,493 |
|
Purchase price adjustments | 1,138 |
|
Total | $ | 26,631 |
|
| |
Allocation of the consideration received to fair value of assets: | |
Proved oil and gas properties (Palm Valley) | $ | 3,403 |
|
Unproved oil and gas properties (Dingo) | 2,957 |
|
Land, buildings, and equipment (Palm Valley) | 370 |
|
Total allocation of the fair value received | 6,730 |
|
Mereenie liabilities given up, net (including basis in properties exchanged and allocated goodwill) | 2,805 |
|
Gain on sale of assets | (36,166 | ) |
Total | $ | (26,631 | ) |
Lease Purchase and Sale and Participation Agreement with VAALCO Energy (USA), Inc. ("VAALCO"). On September 6, 2011, the Company entered into a Lease Purchase and Sale and Participation Agreement (the "VAALCO PSA") with VAALCO.
Pursuant to the VAALCO PSA, the Company received $5.0 million in cash, and VAALCO received an undivided 65% of the Company’s working interest in formations below the top of the Bakken/Three Forks (the "Deep Intervals") in Poplar.
The accounting for this transaction is set forth in the table below:
|
| | | |
| Total |
| (In thousands) |
Cash consideration received | $ | 5,000 |
|
Net book value allocated to Deep Intervals | (829 | ) |
Transaction costs | (162 | ) |
Gain on sale recognized | $ | 4,009 |
|
Acquisition of Non-Controlling Interest in Nautilus Poplar LLC and Acquisition of Additional Working Interests. On September 2, 2011, the Company entered into a Purchase and Sale Agreement (the "Nautilus PSA") between the Company and the non-controlling interest owners of NP, being the Nautilus Technical Group, LLC ("NT") and Eastern Rider, LLC ("ER") (the "Nautilus Sellers"). The Nautilus Sellers included J. Thomas Wilson (a Magellan director and now its President and CEO), a second individual who has served as a consultant to NP, and a third individual who was an employee of NP at the time of the transaction, as well as certain other persons.
The Nautilus PSA provided for the Company's purchase of all membership interests from the Nautilus Sellers in return for (i) $4.0 million in cash (the "Cash Consideration"), (ii) $2.0 million, less certain costs and certain debt owed to Magellan by the Nautilus Sellers, in unregistered shares of Magellan’s common stock, par value $0.01 (the "Net Share Consideration"), and (iii) the potential for future production payments ("Contingent Production Payments"), payable in cash to the Nautilus Sellers, collectively, of up to $5.0 million if certain increased average daily production milestones are achieved. The shares were sold pursuant to Section 4(2) of the Securities Act of 1933. The Cash Consideration was transferred on September 2, 2011. Consistent with the terms of the Nautilus PSA, 1,182,742 of shares in the Net Share Consideration were issued on September 23, 2011. J. Thomas Wilson’s interest in this transaction approximated 52% of the consideration paid to the Nautilus Sellers.
The discounted fair value of the future contingent consideration payable is calculated at the end of each fiscal quarter using a consistent valuation methodology and assumptions. As of June 30, 2013, and 2012, the contingent consideration payable was valued at $3.9 million and $4.1 million, respectively, and is reported in the consolidated balance sheet as contingent consideration payable.
The acquisition of NT’s direct working interests was treated as a business combination for accounting purposes. The fair value of assets acquired and liabilities assumed were recorded at estimated fair value. This estimate was made based on significant unobservable (Level 3) inputs and based on the best information available at the time (see Note 5). A de minimis amount of revenues and earnings related to the working interests acquired is included in the accompanying consolidated statements of operations for the year ended June 30, 2012.
The table below summarizes the consideration paid to the Nautilus Sellers under the Nautilus PSA and the estimated fair value of the assets acquired and liabilities assumed for the working interests acquired from NT.
|
| | | | | | | | | | | | | | | |
| NT non- controlling interest in NP | | NT working interest in Poplar | | ER non- controlling interest in NP | | Total |
| (In thousands) |
Consideration paid to the Nautilus Sellers (1): | | | | | | | |
Cash consideration | $ | 1,920 |
| | $ | 823 |
| | $ | 1,257 |
| | $ | 4,000 |
|
Share consideration (2) | 907 |
| | 389 |
| | 526 |
| | 1,822 |
|
Fair value of contingent consideration payable | 1,993 |
| | 854 |
| | 1,304 |
| | 4,151 |
|
Total | $ | 4,820 |
| | $ | 2,066 |
| | $ | 3,087 |
| | $ | 9,973 |
|
| | | | | | | |
| | | | | | | Total |
| | | | | | | (In thousands) |
Allocation of the consideration paid to the fair value of assets: | | | | | | | |
Oil and gas assets (proved) | | | | | | | $ | 1,462 |
|
Oil and gas assets - Deep Intervals (unproved) | | | | | | | 679 |
|
ARO liability | | | | | | | (75 | ) |
Total | | | | | | | $ | 2,066 |
|
(1) Excludes transaction costs.
(2) Common stock valued at $1.54 per share closing price on the date of the transaction.
Note 3 - Debt
Long term debt relates to a $1.7 million note payable re-financed by NP in January 2011 (the "Note Payable"). This Note Payable will be fully amortized in June 2014. The outstanding principal consisted of the following for the fiscal years ended:
|
| | | | | | | |
| June 30, |
| 2013 | | 2012 |
| (In thousands) |
Note payable | $ | 390 |
| | $ | 870 |
|
Less current portion of note payable | (390 | ) | | (480 | ) |
Long term debt, excluding current portion | $ | — |
| | $ | 390 |
|
As of June 30, 2013, the minimum future principal maturities of long term debt were as follows:
|
| | | |
| Total |
| (In thousands) |
One year | $ | 390 |
|
The variable rate of the note is based upon the Wall Street Journal Prime Rate (the "Index") plus 1.00%, subject to a floor rate of 6.25%. The Index was 3.25% at June 30, 2013, resulting in an interest rate of 6.25% per annum as of June 30, 2013. Under the Note Payable, NP is subject to certain customary financial and restrictive covenants. As of June 30, 2013, NP was in compliance with all financial and restrictive covenants.
In addition, the Company has a $1.0 million working capital line of credit classified as short term debt (the "Line of Credit"). The amount due on the Line of Credit was $51 thousand and $50 thousand as of June 30, 2013, and 2012, respectively. The Line of Credit bears interest at a variable rate, which was 6.25% as of June 30, 2013. The Line of Credit also secures a letter of credit in the amount of $25 thousand in favor of the Bureau of Land Management. As of June 30, 2013, $0.9 million was available under this Line of Credit.
The Note Payable and Line of Credit are collateralized by a first mortgage and an assignment of production from Poplar and are guaranteed by Magellan up to $6.0 million, not to exceed the amount of the principal owed. The carrying amount of the Company's long term debt approximates its fair value due to its variable interest rate, which resets based on the market rates.
Note 4 - Asset Retirement Obligations
The estimated valuation of asset retirement obligations ("AROs") are based on management's historical experience and best estimate of plugging and abandonment costs by field. Assumptions and judgments made by management when assessing an ARO include: (i) the existence of a legal obligation; (ii) estimated probabilities, amounts, and timing of settlements; (iii) the credit-adjusted risk-free rate to be used; and (iv) inflation rates. Accretion expense is recorded under depletion, depreciation, amortization, and accretion in the consolidated statement of operations.
If the fair value of a recorded AROs change, a revision is recorded to both the ARO and the asset retirement capitalized cost. The revision recognized during fiscal year ended June 30, 2013, primarily resulted from a change in the expected timing of estimated abandonment cost for our oil and gas properties.
The following table summarizes the asset retirement obligation activity for the fiscal years ended:
|
| | | | | | | |
| June 30, |
| 2013 | | 2012 |
| (In thousands) |
Fiscal year opening balance | $ | 7,784 |
| | $ | 11,397 |
|
Liabilities assumed | 3 |
| | 3,035 |
|
Liabilities incurred | — |
| | 398 |
|
Accretion expense | 433 |
| | 568 |
|
Sale of assets | — |
| | (6,773 | ) |
Revision to estimate | (758 | ) | | (603 | ) |
Effect of exchange rate changes | (583 | ) | | (238 | ) |
Fiscal year closing balance | 6,879 |
| | 7,784 |
|
Less current asset retirement obligation | 476 |
| | 329 |
|
Long term asset retirement obligation | $ | 6,403 |
| | $ | 7,455 |
|
Note 5 - Fair Value Measurements
The Company follows authoritative guidance related to fair value measurement and disclosure, which establishes a three level valuation hierarchy for disclosure of fair value measurements. The valuation hierarchy categorizes assets and liabilities measured at fair value into one of three different levels depending on the observability of the inputs employed in the measurement using market participant assumptions at the measurement date. A financial instrument's categorization within the valuation hierarchy is based upon the lowest level of input that is significant to the fair value measurement. The three levels are defined as follows:
| |
• | Level 1: Quoted prices in active markets for identical assets. |
| |
• | Level 2: Significant other observable inputs – inputs to the valuation methodology include quoted prices for similar assets and liabilities in active markets and inputs that are observable for the asset or liability, either directly or indirectly, for substantially the full term of the financial instrument. |
| |
• | Level 3: Significant inputs to the valuation model are unobservable inputs. |
The Company's assessment of the significance of a particular input to the fair value measurement in its entirety requires judgment and considers factors specific to the asset or liability. The Company's policy is to recognize transfers in and/or out of a fair value hierarchy as of the end of the reporting period for which the event or change in circumstances caused the transfer. The Company has consistently applied the valuation techniques discussed for all periods presented. During the years ended June 30, 2013, and 2012, there have been no transfers in and/or out of Level 1, Level 2, or Level 3.
Assets and liabilities measured on a recurring basis
The Company's financial instruments, including cash and cash equivalents, accounts receivable and accounts payable are carried at cost, which approximates fair value due to the short term maturity of these instruments. The recorded value of the Line of Credit and Note Payable (see Note 3), approximates fair value due their variable rate structure. The Company's other financial and non-financial assets and liabilities measured on a recurring basis are measured and reported at fair value.
The following table presents items required to be measured at fair value on a recurring basis by the level in which they are classified within the valuation hierarchy for the fiscal years ended:
|
| | | | | | | | | | | | | | | |
| June 30, 2013 |
| Level 1 | | Level 2 | | Level 3 | | Total |
| (In thousands) |
Assets: | | | | | | | |
Cash equivalents (1) | $ | 26,270 |
| | $ | — |
| | $ | — |
| | $ | 26,270 |
|
Securities available for sale (2) | 44 |
| | — |
| | — |
| | 44 |
|
| $ | 26,314 |
| | $ | — |
| | $ | — |
| | $ | 26,314 |
|
Liabilities: | | | | | | | |
Contingent consideration payable | $ | — |
| | $ | — |
| | $ | 3,940 |
| | $ | 3,940 |
|
| | | | | | | |
| June 30, 2012 |
| Level 1 | | Level 2 | | Level 3 | | Total |
| (In thousands) |
Assets: | | | | | | | |
Cash equivalents (1) | $ | 38,565 |
| | $ | — |
| | $ | — |
| | $ | 38,565 |
|
Securities available for sale (2) | 155 |
| | — |
| | — |
| | 155 |
|
| $ | 38,720 |
| | $ | — |
| | $ | — |
| | $ | 38,720 |
|
Liabilities: | | | | | | | |
Contingent consideration payable | $ | — |
| | $ | — |
| | $ | 4,072 |
| | $ | 4,072 |
|
(1) Cash equivalents have maturities of 90 days or less. In the US cash equivalents were held in US Treasury notes and in Australia cash equivalents were held in several time deposit accounts.
(2) Included in the consolidated balance sheets under prepaid and other assets.
The contingent consideration payable is a standalone liability that is measured at fair value on a recurring basis for which there is no available quoted market price, principal market, or market participants. The inputs for this instrument are unobservable and therefore classified as Level 3 inputs. The calculation of this liability is a significant management estimate and uses drilling and production projections, consistent with the Company's reserve report for NP, to estimate future production bonus payments, and a discount rate that is reflective of the Company's credit adjusted borrowing rate. Inputs are reviewed by management on an annual basis and the liability is estimated by converting estimated future production bonus payments to a single net present value using a discounted cash flow model. Payment of future production bonuses are sensitive to the Company's 60 day rolling production average. The contingent consideration payable would increase with significant production increases, and or a reduction in the discount rate.
The following table presents information about significant unobservable inputs to the Company's Level 3 financial liability measured at fair value on a recurring basis for the fiscal years ended:
|
| | | | | | | | |
| | | | | | June 30, |
Description | | Valuation technique | | Significant unobservable inputs | | 2013 | | 2012 |
Contingent consideration payable | | Discounted cash flow model | | Discount rate | | 8.0% | | 8.0% |
| | | | First production payout | | December 31, 2015 | | December 31, 2013 |
| | | | Second production payout | | December 31, 2016 | | December 31, 2015 |
Adjustments to the fair value of the contingent consideration payable is recorded in the consolidated statements of operations under net interest income. The following table presents a roll forward of the contingent consideration payable for the fiscal years ended:
|
| | | | | | | |
| June 30, |
| 2013 | | 2012 |
| (In thousands) |
Fiscal year beginning balance | $ | 4,072 |
| | $ | — |
|
Liability assumed | — |
| | 4,151 |
|
Accretion expense | 326 |
| | 247 |
|
Revision to estimate | (458 | ) | | (326 | ) |
Fiscal year closing balance | $ | 3,940 |
| | $ | 4,072 |
|
Assets and liabilities measured on a nonrecurring basis
Due to the unobservable nature of the significant inputs required to measure these items at fair value, they are classified within Level 3. The following table presents information about significant unobservable inputs to the Company's Level 3 financial assets and liabilities measured at fair value on a nonrecurring basis: fiscal years ended:
|
| | | | | | | | | | |
Description | | Fair value | | Valuation technique | | Significant unobservable inputs | | Range of inputs |
| | (In thousands) | | | | | | |
Acquisition of oil and gas properties under the Nautilus PSA | | $ | 2,141 |
| | Combination of discounted cash flow model and market value approach | | Adjusted oil price | | $95/bbl |
Discount rate | 10.0% |
| | | | | | | | |
Palm Valley oil and gas properties acquired in Santos SA | | $ | 3,403 |
| | Discounted cash flow model | | Contract period | | 17 to 19 years |
Discount rate | 10.0% to 11.5% |
| | | | | | | | |
Issuance of preferred stock to One Stone | | $ | 23,502 |
| | Market value approach | | Issuance price | | $1.22149381 |
The Company also utilizes fair value to perform impairment tests as required on its oil and gas properties. The inputs used to determine such fair value are primarily based upon internally developed cash flow models and is also classified within Level 3.
Note 6 - Income Taxes
The domestic and foreign components of our (loss) income before income taxes are as follows for the fiscal years ended:
|
| | | | | | | |
| June 30, |
| 2013 | | 2012 |
| (In thousands) |
United States | $ | (9,449 | ) | | $ | (6,646 | ) |
Australia | (7,537 | ) | | 30,876 |
|
United Kingdom | (4,047 | ) | | (3,698 | ) |
(LOSS) INCOME BEFORE INCOME TAX | $ | (21,033 | ) | | $ | 20,532 |
|
The following reconciles the Company's effective tax rate to the federal statutory tax rate for the fiscal years ended:
|
| | | | | | | |
| June 30, |
| 2013 | | 2012 |
| (In thousands) |
Tax provision computed per federal statutory rate | $ | (6,310 | ) | | $ | 6,160 |
|
State taxes, net of federal benefit | (40 | ) | | 190 |
|
Foreign rate differential | (60 | ) | | 76 |
|
Non taxable Australian revenue | 288 |
| | (8 | ) |
Goodwill write off | — |
| | 756 |
|
Decreases related to lapse of applicable statute of limitations | 685 |
| | 1,571 |
|
Change in valuation allowance | 7,897 |
| | 9,352 |
|
Australian petroleum resource rent tax | (10,354 | ) | | (5,951 | ) |
Australian petroleum resource rent tax - income tax effect | 3,106 |
| | 1,785 |
|
Taxable dividends from subsidiaries, net of foreign tax credits | (709 | ) | | (1,152 | ) |
Foreign tax credit adjustment | 787 |
| | 649 |
|
Capital loss adjustment | 309 |
| | (3,006 | ) |
Additional basis related to the Santos SA | — |
| | (18,118 | ) |
Impact of rate change | 140 |
| | 457 |
|
Foreign currency translation differential | 2,912 |
| | 1,375 |
|
Other items | 83 |
| | (87 | ) |
Consolidated income tax benefit | $ | (1,266 | ) | | $ | (5,951 | ) |
The following summarizes components of our income tax provision for the fiscal years ended:
|
| | | | | | | |
| June 30, |
| 2013 | | 2012 |
| (In thousands) |
Current income tax: | | | |
United States | $ | — |
| | $ | — |
|
Australia | — |
| | — |
|
United Kingdom | — |
| | — |
|
Total current income tax provision | — |
| | — |
|
| | | |
Deferred income tax: | | | |
United States | — |
| | — |
|
Australia | (1,266 | ) | | (5,951 | ) |
United Kingdom | — |
| | — |
|
Total deferred income benefit provision | (1,266 | ) | | (5,951 | ) |
Consolidated income benefit provision | $ | (1,266 | ) | | $ | (5,951 | ) |
| | | |
Effective tax rate | 6 | % | | (29 | )% |
The Company's effective tax rate was increased to positive 6% primarily due to the extension of the Australian Petroleum Resource Rent Tax ("PRRT") to onshore projects which increased the related deferred tax asset.
Significant components of the Company's deferred tax assets and liabilities can be summarized as follows for the fiscal years ended:
|
| | | | | | | |
| June 30, |
| 2013 | | 2012 |
| (In thousands) |
Deferred tax liabilities: | | | |
Land, buildings and equipment | $ | (4,132 | ) | | $ | (2,767 | ) |
Stepped up basis of oil and gas properties | — |
| | (550 | ) |
Australian petroleum resource rent tax - income tax effect | (2,165 | ) | | (1,785 | ) |
Other items | (237 | ) | | (261 | ) |
Total deferred tax liabilities | (6,534 | ) | | (5,363 | ) |
| | | |
Deferred tax assets: | | | |
Asset retirement obligations | 2,194 |
| | 2,210 |
|
Net operating losses, capital losses, and foreign tax credit carry forwards | 31,354 |
| | 28,139 |
|
Australian petroleum resource rent tax | 13,145 |
| | 5,951 |
|
United Kingdom exploration costs and net operating losses | 3,777 |
| | 3,224 |
|
Stock option compensation | 1,971 |
| | 1,851 |
|
Interest | — |
| | 539 |
|
Australian capitalized legal costs | 343 |
| | 514 |
|
Other items | 557 |
| | 579 |
|
Total deferred tax asset | 53,341 |
| | 43,007 |
|
Valuation allowance | (39,590 | ) | | (31,693 | ) |
Net long term deferred tax asset | $ | 7,217 |
| | $ | 5,951 |
|
For the fiscal year ended June 30, 2013, the valuation allowance increased by $7.9 million, primarily due to additional book losses and a partial valuation allowance against the increase in the PRRT deferred tax assets.
The tax benefit recorded for fiscal year 2013 totals $1.3 million. In addition to corporate income tax, the income tax benefit includes the tax effect of the Company's obligation related to the Australian PRRT. The extension of PRRT to onshore projects was enacted during fiscal year 2012 and effective from July 1, 2012. As a consequence of the extension of the Australian PRRT regime to onshore petroleum products, a deferred tax benefit of $6.0 million was recorded during fiscal year 2012. On June 28, 2013, Australian Tax and Superannuation Laws Amendment (2013 Measures No. 1) Bill 2013 received Royal Assent. This new legislation clarifies that the Company is able to access 100% of the costs incurred in relation to the Palm Valley field since July 1, 2002. As a result of this legislative change, the gross deferred tax assets have been updated to reflect the additional basis available in costs incurred since July 1, 2002. Primarily as a result of additional qualifying expenditures incurred in Australia during fiscal year 2013 which are expected to be realized in future periods, the net deferred tax asset balance increased to $7.2 million during fiscal year 2013.
The US gross deferred tax assets and liabilities at June 30, 2013 consist primarily of foreign tax credits, property, plant and equipment, and stock options. The Australian deferred tax assets and liabilities at June 30, 2013 consist primarily of acquisition and development costs, asset retirement obligations, net operating and capital loss carry forwards, and other assets which will result in tax deductions when paid. Australian net operating and capital losses carry forward indefinitely.
After reviewing all positive and negative evidence, a valuation allowance is still recorded against all the net deferred tax assets related to corporate income taxes in the US, Australia and the UK. A partial valuation allowance is recorded against the deferred tax assets that relate to the Australian PRRT. As a result the Company has a net deferred tax asset of $7.2 million as of June 30, 2013.
As of June 30, 2013, the Company remains subject to examination in the following major tax jurisdictions for the tax years indicated below:
|
| | |
Jurisdiction | | Tax Years Subject to Examination: |
US Federal | | 2011 - 2012 |
Colorado | | 2010 - 2012 |
Connecticut | | 2010 |
Maine | | 2010 - 2012 |
Montana | | 2011 - 2012 |
Australia | | 2009 - 2012 |
United Kingdom | | 2009 - 2012 |
At June 30, 2013, the Company had net operating loss and foreign tax credit carry forwards for US Federal and State Income Tax purposes, respectively, which are scheduled to expire periodically as follows:
|
| | | | | | | |
| State Net Operating Losses | | Federal Foreign Tax Credit |
| (In thousands) |
Expires: | | | |
2017 | $ | 301 |
| | $ | 310 |
|
2018 | 3,219 |
| | — |
|
2019 | 1,432 |
| | 1,411 |
|
2020 | 1,191 |
| | 144 |
|
2021 | — |
| | 1,006 |
|
2022 | — |
| | 3,030 |
|
2023 and thereafter | — |
| | 4,050 |
|
Total | $ | 6,143 |
| | $ | 9,951 |
|
There are no uncertain tax positions that would meet the more-likely-than-not recognition threshold for the fiscal years ended June 30, 2013, or 2012.
Note 7 - Stock Based Compensation
The 2012 Stock Incentive Plan
On January 16, 2013, the Company's shareholders approved the Magellan Petroleum Corporation 2012 Omnibus Incentive Compensation Plan (the "2012 Stock Incentive Plan"). The 2012 Stock Incentive Plan replaces the Company's 1998 Stock Incentive Plan (the "1998 Stock Plan"). The 2012 Stock Incentive Plan provides for the granting of stock options, stock appreciation rights, restricted stock and/or restricted stock units, performance shares and/or performance units, incentive awards, cash awards, and other stock based awards to employees, including officers, directors, and consultants of the Company (or subsidiaries of the Company) who are selected by the Compensation, Nominating and Governance Committee of the Board of Directors of the Company to receive incentive compensation awards. The stated maximum number of shares of the Company's common stock authorized for awards under the 2012 Stock Incentive Plan is 5,000,000 shares plus any remaining shares under the 1998 Stock Plan immediately before the effective date of the 2012 Stock Incentive Plan, which was 288,435 as of January 15, 2013. The maximum aggregate annual number of common shares or options that may be granted to one participant is 1,000,000, and the maximum annual number of performance shares, performance units, restricted stock or restricted stock units is 500,000. The maximum term of the 2012 Stock Incentive Plan is ten years.
Stock Option Grants
Under the 2012 Stock Incentive Plan, stock option grants may contain both time based or performance based vesting provisions. As of June 30, 2013, under the 2012 Stock Incentive Plan, all PBOs granted were fully vested and 4,776,769 shares, including forfeited shares, were available for future issuance. During the fiscal year ended June 30, 2013, 1,627,500 options were granted of which 75,000 were issued as PBOs and 882,500 options were issued outside of the 1998 Stock Plan. Options outstanding have expiration dates ranging from January 16, 2014, through January 14, 2023.
The following table summarizes the stock option activity for the fiscal years ended:
|
| | | | | | | | | |
| June 30, |
| 2013 | | 2012 |
| Number of Shares | | WAEPS (1) | | Number of Shares | | WAEPS (1) |
Fiscal year beginning balance | 6,753,125 |
| | $1.44 | | 5,200,000 |
| | $1.49 |
Granted | 1,627,500 |
| | $1.23 | | 1,675,000 |
| | $1.10 |
Exercised | — |
| | $0.00 | | (21,875 | ) | | $1.60 |
Forfeited | (591,668 | ) | | $1.16 | | (100,000 | ) | | $1.72 |
Options outstanding at end of fiscal year | 7,788,957 |
| | $1.33 | | 6,753,125 |
| | $1.44 |
| | | | | | | |
Weighted average remaining contractual term | | | 5.9 years | | | | 6.8 years |
(1) Weighted average exercise price per share
Cash received from the exercise of stock options for the fiscal year ended June 30, 2012, was less than $0.1 million. No stock options were exercised during 2013. The following table summarizes options outstanding and exercisable as of June 30, 2013:
|
| | | | | | | | | | |
| | | | Options outstanding and exercisable |
Range of exercise prices | | Number of shares | | Weighted average remaining contractual life | | Weighted average exercise price |
$0.79 | - | $1.09 | | 1,277,500 |
| | 8.5 years | | $1.04 |
$1.10 | - | $1.13 | | 1,691,666 |
| | 8.5 years | | $1.11 |
$1.14 | - | $1.18 | | 100,000 |
| | 4.6 years | | $1.16 |
$1.19 | - | $1.40 | | 3,100,000 |
| | 2.9 years | | $1.20 |
$1.41 | - | $2.41 | | 1,619,791 |
| | 5.7 years | | $2.02 |
| | | | 7,788,957 |
| | 5.9 years | | $1.33 |
| | | | | | | | |
Aggregate intrinsic value | $ | 21,383 |
| | | | |
The fair value of shares issued under the 2012 Stock Incentive Plan was estimated using the following weighted-average assumptions for the fiscal years ended:
|
| | | | | | | | | |
| June 30, |
| 2013 | | 2012 |
Number of options | 1,627,500 | | 1,675,000 |
Weighted-average grant date fair value per share | $0.61 | | $0.66 |
Expected dividend | $0.00 | | $0.00 |
Forfeiture rate | — | | — |
Risk free interest rate | 0.6 | % | - | 1.3% | | 1.0 | % | - | 1.3% |
Expected life | 5.1 |
| - | 6.0 years | | 5.3 |
| - | 6.0 years |
Expected volatility (based on historical price) | 60.3 | % | - | 63.5% | | 61.2 | % | - | 62.8% |
Stock Compensation Expense
The Company recorded $0.8 million and $1.6 million of stock compensation expense for the fiscal years ended June 30, 2013, and 2012, respectively. Stock based compensation is included under general and administrative expense in the consolidated statements of operations. At June 30, 2013, there was a total of $0.8 million in unrecognized stock compensation expense related to stock options granted. This cost is expected to be recognized over a weighted-average period of 1.9 years. The amount of unrecognized compensation expense noted above does not necessarily represent the amount that will ultimately be realized by the Company in its consolidated statement of operations. During the fiscal year ending June 30, 2014, it is expected that an additional 1,367,500 stock options will vest.
The Company's compensation policy is designed to provide the Company's non-employee directors with a portion of their annual base Board service compensation in the form of equity. Between July 1, 2012, and June 30, 2013, the Company issued a total of 175,000 shares of its common stock to non-employee directors pursuant to this policy.
Note 8 - Preferred Stock
Series A Convertible Preferred Stock Financing Agreement
On May 10, 2013, the Company entered into a Series A Convertible Preferred Stock Purchase Agreement (the "Series A Purchase Agreement") with an affiliate of One Stone Energy Partners, L.P. ("One Stone"). Pursuant to the terms of the Series A Purchase Agreement, the Company issued 19,239,734 shares of Series A Convertible Preferred Stock, par value $0.01 per share (the "Series A Preferred Stock"), at a purchase price of $1.22149381 per share (the "Purchase Price"), for aggregate proceeds of approximately $23.5 million. Subject to certain conditions, each share of Series A Preferred Stock and any related unpaid accumulated dividends will be convertible into one share of the Company's Common Stock, par value $0.01 per share (the "Common Stock"), at an initial conversion price of $1.22149381 per share (the "Conversion Price").
The Series A Purchase Agreement also includes the following key terms:
| |
• | Dividends. Holders of Series A Preferred Stock will be entitled to a dividend equivalent to 7.0% per annum on the face value, which will be the Purchase Price plus any accumulated unpaid dividends, payable quarterly in arrears. Dividends will generally be payable in cash or in kind (in the form of additional shares of Series A Preferred Stock), at the Company's option. |
| |
• | Conversion. Each share of Series A Preferred Stock will be convertible at any time, at One Stone's option, into one share of Common Stock, subject to the Conversion Cap prior to the approval of the Proposal by the Common Stock shareholders. The Series A Preferred Stock is entitled to customary anti-dilution protections. |
| |
• | Voting. The Series A Preferred Stock will be entitled to vote on an as-converted basis with the Common Stock, subject to the Voting Cap prior to the approval of the Proposal by the Common Stock shareholders (which approval was received on August 14, 2013). |
| |
• | Forced Conversion. At any time after the third anniversary of the Closing Date, the Company will have the right to cause One Stone to convert all, but not less than all, of the shares of Series A Preferred Stock into shares of Common Stock, if, among other conditions: (i) the per share price of Common Stock equals or exceeds 200% of the Conversion Price for a period of 20 out of 30 consecutive trading days, (ii) the average daily trading volume of shares of Common Stock exceeds an amount equal to the number of shares of Common Stock issuable upon the conversion of all outstanding shares of Series A Preferred Stock divided by 45, and (iii) the resale of shares of Common Stock is covered by an effective shelf registration statement, or such shares as can be sold under Rule 144 under the US Securities Act of 1933, as amended (the "Securities Act"). |
| |
• | Redemption. At any time after the third anniversary of the Closing Date, and upon 30 days prior written notice, the Company may elect to redeem all, but not less than all, shares of Series A Preferred Stock for an amount equal to the greater of (i) the closing sale price of the Common Stock on the date the Company delivers such notice multiplied by the number of shares of Common Stock issuable upon conversion of the outstanding Series A Preferred Stock, and (ii) a cash payment that, when considering all cash dividends already paid, allows One Stone to achieve a 20% annualized internal rate of return on the then outstanding Series A Preferred Stock. One Stone will have the right to convert the Series A Preferred Stock into shares of Common Stock at any time prior to the close of business on the redemption date. |
| |
• | Change in Control. In the event of a Change in Control (as defined) of the Company, holders of Series A Preferred Stock will have the option to (i) convert Series A Preferred Stock into Common Stock immediately prior to the Change in Control, (ii) in certain circumstances, receive stock or securities in the acquirer of the Company having substantially identical terms as those of the Series A Preferred Stock, or (iii) receive a cash payment that, when considering all cash dividends already paid, allows One Stone to achieve a 20% annualized internal rate of return on the then outstanding Series A Preferred Stock. |
The Company has determined that a Change in Control (as defined) is not solely within the Company's control and the Series A Preferred Stock is therefore presented in the consolidated balance sheets under temporary equity, outside of permanent equity.
| |
• | Liquidation. Upon a liquidation event, holders of Series A Preferred Stock will be entitled to a non-participating liquidation preference per share of Series A Preferred Stock equal to (i) 115% of the Purchase Price until the second anniversary of the issuance of Series A Preferred Stock, (ii) 110% of the Purchase Price after the second anniversary of issuance until the third anniversary of issuance, (iii) 105% of the Purchase Price after the third anniversary of issuance until the fourth anniversary of issuance, and (iv) thereafter, at the Purchase Price. |
| |
• | Ranking. Series A Preferred Stock will rank senior to Common Stock with respect to dividend rights and rights on liquidation, winding up, and dissolution. |
| |
• | Board Representation. For so long as One Stone owns at least 15% or 10% of the fully diluted shares of Common Stock (assuming full conversion of the Series A Preferred Stock), One Stone will have the right to appoint two members or one member, respectively, to the Company's Board of Directors (the "Board"). These directors will not be subject to director elections by the holders of Common Stock at the Company's annual meetings of shareholders. |
| |
• | Minority Veto Rights. For so long as One Stone owns at least 10% of the fully diluted Common Stock (assuming full conversion of the Series A Preferred Stock), One Stone will hold veto rights with respect to (i) capital expenditures greater than $15.0 million that are not provided for in the then-current annual budget; (ii) certain related-party transactions; (iii) changes to the Company's principal line of business; and (iv) an increase in the size of the Board to a number greater than 12. |
| |
• | Standstill. For a period of two years following the date of the Series A Purchase Agreement, One Stone is prohibited from (i) acquiring direct or beneficial control of any additional equity securities of the Company or any rights thereto; (ii) participating in or forming any voting group or voting trust with respect to any voting securities of the Company; and (iii) seeking to influence, modify, or control management, the Board, or any business, policies, or actions of the Company. Until such time as One Stone no longer holds any Series A Preferred Stock, One Stone is prohibited from engaging, directly or indirectly, in any short selling of the Common Stock. |
| |
• | Registration Rights. One Stone will be entitled to resale registration rights with respect to the shares of Common Stock issuable upon conversion of the Series A Preferred Stock, pursuant to a separate Registration Rights Agreement executed on the Closing Date. |
The Company has analyzed the embedded features of the issuance of the the Series A Preferred Stock and has determined that none of the embedded features meet the requirements under US GAAP to be bifurcated from the the Series A Preferred Stock contract and accounted for separately as a derivative. The Company also recorded the transaction by recognizing the fair value of the Series A Preferred Stock at the time of issuance in the amount of $23.5 million, net of offering costs of $0.5 million. The Company will accrete the Series A Preferred Stock to the liquidation or redemption value when it becomes probable that an event or events underlying the liquidation or redemption are probable.
For the fiscal year ended June 30, 2013, the Company accrued dividends in the amount of $0.2 million and recorded accretion in the amount of $0.5 million to reflect the initial estimated fair value at which the preferred stock was recorded.
Note 9 - Stockholders' Equity
Treasury Stock
On September 24, 2012, the Company announced that its Board of Directors had approved a stock repurchase program authorizing the Company to repurchase up to a total value of $2.0 million in shares of its common stock. The size and timing of such purchases will be based on market and business conditions as well as other factors. The Company is not obligated to purchase any shares of its common stock. The authorization will expire on August 21, 2014, and purchases under the program can be discontinued at any time. As of June 30, 2013, the Company repurchased 149,539 shares pursuant to this program.
On January 14, 2013, the Company entered into a Collateral Purchase Agreement (the "Collateral Agreement") with Sopak AG, a Swiss subsidiary of Glencore International plc ("Sopak"), pursuant to which the Company agreed to purchase: (i) 9,264,637 shares of the Company's common stock, (ii) a warrant granting Sopak the right to purchase from the Company an
additional 4,347,826 shares of common stock, and (iii) a Registration Rights Agreement, dated as of June 29, 2009, and amended as of October 14, 2009, and June 23, 2010, between the Company, Young Energy Prize S.A., a Luxembourg corporation ("YEP"), and ECP Fund, SICAV-FIS, a Luxembourg corporation ("ECP"), which is a subsidiary of Yamalco Investments Limited, a Cyprus company ("Yamalco"), for a purchase price of $10.0 million. The Company accounted for the the Purchase Price of $10.0 million by allocating (i) $0.8 million to the fair value of the warrant and (ii) $9.2 million to the purchase of 9,264,637 shares of common stock, resulting in a value per share of $0.993 (refer below). The Collateral Agreement was subsequently amended on January 15, 2013, and completed on January 16, 2013. YEP, ECP, and Yamalco are entities affiliated with Nikolay V. Bogachev, a former director of the Company.
All repurchased common stock shares are currently being held in treasury at cost, including direct issuance cost. The following table summarizes the Company's treasury stock activity for the fiscal year ended June 30, 2013:
|
| | | | | | | | |
| Number of shares | | Average price per share | | Amount |
| (In thousands, except share and per share amounts) |
Repurchases through the stock repurchase program | 149,539 |
| | $0.916 | | $ | 137 |
|
Repurchase through the Collateral Agreement (1) | 9,264,637 |
| | $0.993 | | $ | 9,196 |
|
Total treasury stock | 9,414,176 |
| | | | $ | 9,333 |
|
(1) Purchase price of $10.0 million reduced by the fair value of the warrant.
Retired Warrant
The Company formally retired the warrant purchased from Sopak pursuant to the Collateral Agreement. The fair value of the warrant was estimated using the Black-Scholes-Merton pricing model and determined to be approximately $0.8 million, which was included as a reduction of additional paid in capital in the consolidated balance sheet.
Assumptions used in estimating the fair value of the warrant included: (i) the common stock price on the repurchase date of $0.90; (ii) the exercise price of the warrant of $1.15; (iii) an expected dividend of $0; (iv) a risk free interest rate of 0.2%; (v) a remaining contractual term of 1.5 years; and (vi) an expected volatility based on historical prices of 60.8%.
Note 10 - (Loss) Earnings Per Share
For the year ended June 30, 2012, outstanding stock options that had an exercise price below the average stock price would have resulted in 448,269 incremental dilutive shares. There is no dilutive effect on loss per share for the fiscal year ended June 30, 2013 as a result of net losses.
The following table summarizes the computation of basic and diluted (loss) earnings per share for the fiscal years ended:
|
| | | | | | | |
| June 30, |
| 2013 | | 2012 |
| (In thousands, except share and per share amounts) |
NET (LOSS) INCOME APPLICABLE TO MAGELLAN PETROLEUM CORPORATION | $ | (19,767 | ) | | $ | 26,498 |
|
Preferred stock dividend and accretion of preferred stock | (722 | ) | | — |
|
NET (LOSS) INCOME ATTRIBUTABLE TO COMMON STOCKHOLDERS | $ | (20,489 | ) | | $ | 26,498 |
|
| | | |
| | | |
Basic weighted-average shares outstanding | 49,642,083 |
| | 53,592,958 |
|
Add: dilutive effects of stock options and unvested stock grants | — |
| | 448,269 |
|
Diluted weighted-average common shares outstanding | 49,642,083 |
| | 54,041,227 |
|
| | | |
Basic net loss (earnings) per common share | $(0.41) | | $0.49 |
Diluted net loss (earnings) per common share | $(0.41) | | $0.49 |
The following table summarizes potentially dilutive securities excluded from the calculation of diluted shares outstanding for the fiscal years ended:
|
| | | | | |
| June 30, |
| 2013 | | 2012 |
Series A convertible preferred stock | 19,239,734 |
| | — |
|
Stock options | — |
| | 100,000 |
|
Non-vested restricted stock | 75,000 |
| | — |
|
Total potentially dilutive securities | 19,314,734 |
| | 100,000 |
|
There were no other potentially dilutive items for the years ended June 30, 2013, and 2012.
Note 11 - Segment Information
The Company conducts its operations through three wholly owned subsidiaries: NP, which operates in the US; MPA, which is primarily active in Australia, and MPUK, which includes our operations in the UK, as well as Corporate, which is treated as a cost center. See Note 1 - Basis of Presentation, for additional information regarding the Company's realignment of its reporting segments.
The following table presents segment information for the fiscal years ended:
|
| | | | | | | |
| June 30, |
| 2013 | | 2012 |
| (In thousands) |
Revenues: | | | |
NP | $ | 6,131 |
| | $ | 6,173 |
|
MPA | 939 |
| | 7,533 |
|
Corporate | 329 |
| | 646 |
|
Inter-segment eliminations | (329 | ) | | (640 | ) |
Consolidated revenues | $ | 7,070 |
| | $ | 13,712 |
|
| | | |
Net (loss) income attributable to Magellan Petroleum Corporation: | | | |
NP | $ | (326 | ) | | $ | 2,154 |
|
MPA | (6,833 | ) | | 29,260 |
|
MPUK | (4,726 | ) | | (5,068 | ) |
Corporate (1) | 27,523 |
| | (5,416 | ) |
Inter-segment eliminations | (35,405 | ) | | 5,568 |
|
Consolidated net (loss) income attributable to Magellan Petroleum Corporation | $ | (19,767 | ) | | $ | 26,498 |
|
| | | |
Assets: | | | |
NP | $ | 26,093 |
| | $ | 10,833 |
|
MPA | 32,735 |
| | 62,535 |
|
MPUK | 2,021 |
| | 5,213 |
|
Corporate | 96,229 |
| | 59,099 |
|
Inter-segment eliminations | (74,806 | ) | | (45,106 | ) |
Consolidated assets | $ | 82,272 |
| | $ | 92,574 |
|
| | | |
Expenditures for additions to long lived assets: | | | |
NP | $ | 2,124 |
| | $ | 4,857 |
|
MPA | 192 |
| | 3,440 |
|
MPUK | 350 |
| | 1,135 |
|
Corporate | 259 |
| | 145 |
|
Consolidated expenditures for long lived assets | $ | 2,925 |
| | $ | 9,577 |
|
(1) During fiscal year June 30, 2013, approximately $35.9 million was included in Corporate net income represented by cash dividends received from MPA, and a deemed distribution related to the transfer of MPUK from MPA to MPC. These intercompany transactions have been eliminated in arriving at the consolidated results.
The following table summarizes other significant items for the fiscal years ended:
|
| | | | | | | |
| June 30, |
| 2013 | | 2012 |
| (In thousands) |
Depletion, depreciation, amortization, and accretion: | | | |
NP | $ | 988 |
| | $ | 819 |
|
MPA | 413 |
| | 695 |
|
Corporate | 133 |
| | 230 |
|
Consolidated depletion, depreciation, amortization, and accretion | $ | 1,534 |
| | $ | 1,744 |
|
| | | |
Lease operating: | | | |
NP | $ | 4,851 |
| | $ | 5,232 |
|
MPA | 2,186 |
| | 7,665 |
|
Consolidated lease operating | $ | 7,037 |
| | $ | 12,897 |
|
| | | |
Exploration: | | | |
NP | $ | 398 |
| | $ | 1,495 |
|
MPA | 4,169 |
| | 2,448 |
|
MPUK | 3,700 |
| | 2,348 |
|
Consolidated exploration | $ | 8,267 |
| | $ | 6,291 |
|
| | | |
Income tax benefit (expense): | | | |
MPA | $ | 1,266 |
| | $ | 5,951 |
|
Consolidated income tax benefit (expense) | $ | 1,266 |
| | $ | 5,951 |
|
Note 12 - Commitments
Operating leases. The following table summarizes the Company's future minimum rental commitments under non-cancelable operating leases, net of guaranteed sublease income, as of June 30, 2013:
|
| | | |
| Total |
| (In thousands) |
Amounts payable in fiscal year: | |
2014 | $ | 162 |
|
2015 | 262 |
|
2016 | 268 |
|
2017 | 273 |
|
2018 and thereafter | 90 |
|
Total | $ | 1,055 |
|
Rental expenses for each of the years ended June 30, 2013, and 2012, were $0.6 million and, $0.6 million, respectively.
Purchase obligations. Although the Company is committed to certain exploration and capital expenditures related to MPA, some of these expenses may be farmed out to third parties. Amounts payable under these firm commitments for fiscal year 2014 were $5.7 million as of June 30, 2013.
Contingent production payments. In September 2011, the Company entered into a Purchase and Sale Agreement (the "Nautilus PSA") among the Company and the non-controlling interest owners of NP for the Company's acquisition of the sellers' interests in NP (the "Nautilus Transaction"). The Nautilus PSA provides for potential future contingent production payments, payable by the Company in cash to the sellers, of up to a total of $5.0 million if certain increased average daily production milestones for the underlying properties are achieved. J. Thomas Wilson, a director and chief executive officer of the Company, has an approximate 52% interest in such contingent payments. See Note 5 above for information regarding the
estimated discounted fair value of the future contingent consideration payable related to the Nautilus Transaction.
FINRA review. On August 28, 2012, Stratex Oil & Gas Holdings, Inc. ("Stratex"), announced an unsolicited proposal for the acquisition of the Company's common stock (the "Stratex Announcement"). On September 10, 2012, the Company announced that its Board of Directors, after carefully considering the unsolicited proposal, had determined not to pursue the Stratex proposal. On September 12, 2012, the Company received a subpoena from the SEC for the production of documents in connection with these announcements. On May 31, 2013, the Company received a letter dated May 30, 2013 from the Staff of the SEC indicating that the investigation relating to the announcements regarding an unsolicited proposal on August 28, 2012 by Stratex Oil & Gas Holdings, Inc. for the acquisition of the Company's common stock, had been completed as to the Company, against whom the Staff does not intend to recommend any enforcement action by the SEC. The Company believes that this matter is now concluded as the Company also received a letter from the Financial Industry Regulatory Authority ("FINRA") on April 30, 2013 indicating that FINRA had completed its related review regarding this matter, which letter also indicated that FINRA had referred its review to the SEC for whatever action, if any, the SEC deemed appropriate.
Sopak Collateral Agreement. The Company has estimated that there is the potential for a statutory liability of approximately $1.0 million of required US Federal tax withholdings and any applicable penalties and interest related to the Collateral Agreement as described in Note 9. As a result, as of June 30, 2013, we have recorded a total liability of $1.0 million under accrued and other liabilities in the consolidated balance sheet included in this report. The Company is in the process of addressing its US Federal tax withholdings requirements. The Company has a legally enforceable right to collect from Sopak any amounts owed to the IRS as a result of the Collateral Agreement. As a result, we have recorded a corresponding receivable under prepaid and other assets in the consolidated balance sheet of $1.0 million as of June 30, 2013.
Note 13 - Related Party Transactions
US Federal tax withholding. During the third quarter of fiscal year 2012, the Company identified a potential liability of approximately $2.0 million related to the Company's failure to make the required US Federal tax withholding in the course of its initial acquisition of NP. In October 2009, Magellan acquired 83.5% of the membership interests in NP (the "Poplar Acquisition"), from the two majority owners of NP, White Bear LLC ("White Bear") and YEP I, SICAV-FES ("YEP I"). Both of these entities are affiliated with Mr. Bogachev, a former Director of Magellan and a foreign national. Due to the status of YEP I as foreign entity and the members of White Bear as foreign nationals, Magellan was required to make US Federal tax withholdings from the payments to or for the benefit of White Bear and YEP I. Of the $2.0 million liability, $1.3 million was estimated to relate to the interest sold by White Bear, $0.6 million to the interest sold by YEP I, and $0.1 million to Magellan's interest on late payment of the US Federal tax withholdings. Upon the filing of US income tax returns in relation to the Poplar Acquisition and payment of corresponding income taxes by White Bear and YEP I, Magellan is deemed to be relieved of its liability for the US Federal tax withholdings as well as related penalties and interest except for Magellan's interest on late payment of the US Federal tax withholdings.
With regards to White Bear, Mr. Bogachev filed his US income tax return and paid taxes due on the Poplar Acquisition, and Magellan has no further related potential liability. With regards to YEP I, which is now a defunct entity, Magellan concluded that it was unlikely that one of YEP I's successor entities would file a corresponding US income tax return. As a result, the Company initiated a disclosure process with the IRS. As a result of this disclosure process the Company's total liability with respect to this matter was determined to be approximately $0.1 million, which was paid as of June 30, 2013.
As of June 30, 2012, we recorded a total liability of $1.0 million under accrued and other liabilities in the consolidated balance sheets related to this matter. That amount is comprised of the $0.3 million payment to Mr. Bogachev, $0.6 million in withholdings, penalties, and interest related to YEP I, and $0.1 million related to Magellan's interest on late payment of the US Federal tax withholdings. The effect of the disclosure process with the IRS on the consolidated statements of operations for the year ended June 30, 2012, resulted in an expense of $0.9 million recorded under general and administrative expense and an interest expense of $0.1 million. The effect of this transaction on the consolidated statements of operations for the year ended June 30, 2013, resulted in other income of $0.4 million representing the difference between the original estimate and the estimated final liability of $0.1 million related to the YEP I withholding obligation.
Office lease. The Company leased its prior Denver office space from an entity owned, in part, by J. Thomas Wilson, President and CEO of the Company and a member of the Company's Board of Directors. The total lease expense paid under this arrangement was $11 thousand and $72 thousand for the fiscal years ended June 30, 2013, and 2012, respectively. Following the relocation of the Company's headquarters to Denver, Colorado, a lease agreement for new office space was entered into with an unrelated party in August 2012. Separately, Mr. Wilson provided consulting services to the Company related to its Australian operations while a member of the Board of Directors but prior to becoming President and CEO of the Company in September 2011. As a result, consulting fees of $0 and $59 thousand for fiscal years ended June 30, 2013, and 2012, respectively, were paid to Mr. Wilson.
PFC Energy. J. Robinson West, the Chairman of the Board of Directors of the Company, is also Chairman, Founder, and CEO of PFC Energy ("PFC"). PFC has served as a consultant for the Company on various Australian projects. As of June 30, 2013 and 2012, there were no consulting arrangements between the Company and PFC in place or planned. The total consulting fees paid to PFC during the fiscal year ended June 30, 2012, was $64 thousand for work performed primarily in fiscal year 2011.
See Note 2 for information related to transactions the Company entered into with NT and ER, effective September 1, 2011.
Note 14 - Employee Severance Costs
The Company is required to record charges for one-time employee severance benefits and other associated costs as incurred. In July 2012, the Company incurred severance costs payable in connection with the termination of the employment of certain Corporate employees pursuant to the terms of their employment agreements. For the fiscal year ended June 30, 2013, the Company expensed total employee-related severance costs of $0.8 million, all of which were charged to general and administrative expense in the consolidated statements of operations. The Company does not expect any additional benefits or other associated costs related to these terminations. The liability related to these severance costs is included in the consolidated balance sheet under accrued and other liabilities.
A reconciliation of the beginning and ending liability balance for charges to general and administrative expense and cash payments is as follows for the fiscal year ended:
|
| | | |
| June 30,
2013 |
| (In thousands) |
Fiscal year beginning balance | $ | — |
|
Charges to general and administrative expense | 837 |
|
Cash payments | (419 | ) |
Fiscal year closing balance | $ | 418 |
|
Note 15 - Subsequent Events
Dingo gas supply and purchase agreement
On September 12, 2013, Magellan Petroleum Corporation (NT) Pty Ltd, a wholly owned subsidiary of MPA entered into a gas supply and purchase agreement (the "Dingo GSPA") with PWC for the long term sale of gas from the Company's Dingo gas field. Pursuant to the Dingo GSPA, the Company has contracted to supply up to 31.0 petajoules, equivalent to 30.1 Bcf, of gas to PWC on a 100% take-or-pay basis over a supply period of up to 20 years.
Note 16 - Supplemental Oil and Gas Information (Unaudited)
Supplemental Oil and Gas Reserve Information
The Company relies upon a combination of internal technical staff and third party consulting arrangements for reserve estimation and review. The reserve information presented below is based on estimates of net proved reserves as of June 30, 2013, and 2012, and was prepared in accordance with guidelines established by the SEC.
In the US, reserve estimates were prepared by the Company's Operations Manager, Blaine Spies, for the fiscal years ended June 30, 2013, and 2012, and were audited by the Company's independent petroleum engineering firm, Allen & Crouch Petroleum Engineers ("A&C"), for the same reporting periods. A copy of the summary reserve audit report of A&C is provided as Exhibit 99.1 to this Annual Report on Form 10-K. A&C does not own an interest in any of Magellan's oil and gas properties and is not employed by Magellan on a contingent basis.
In Australia, reserve estimates were prepared by the Ryder Scott Company ("RS"), an independent petroleum engineering firm, for the fiscal years ended June 30, 2013, and 2012. Reserve estimates were prepared in accordance with the Company's internal control procedures, which include the verification of input data used by RS, and management review and approval. A copy of the summary reserve report of RS is provided as Exhibit 99.2 to this Annual Report on Form 10-K. RS does not own an interest in any of Magellan's oil and gas properties and is not employed by Magellan on a contingent basis.
Proved reserves are the estimated quantities of oil, gas, and natural gas liquids, which, by analysis of geoscience and engineering data, can be estimated with reasonable certainty to be economically producible from a given date forward, from known reservoirs, and under existing economic conditions, operating methods, and government regulations prior to the time at which contracts providing the right to operate expire, unless evidence indicates that renewal is reasonably certain, regardless of whether deterministic or probabilistic methods are used for the estimation. Existing economic conditions include prices and costs at which economic producibility from a reservoir is to be determined and the price to be used is the average price during the 12-month period prior to the ending date of the period covered by the report, determined as an unweighted arithmetic average of the first-day-of-the-month price for each month within such period, unless prices are defined by contractual arrangements, excluding escalations based upon future conditions. All of the Company's estimated proved reserves are located in the US and Australia.
Analysis of Changes in Proved Reserves
The following table sets forth information regarding the Company's estimated proved oil and gas reserve quantities. The Company emphasizes that reserve estimates are inherently imprecise and that estimates of new discoveries and undeveloped locations are more imprecise than estimates of established producing oil and gas properties. Accordingly, these estimates are expected to change as future information becomes available.
|
| | | | | | | | | | | |
| United States | Australia (1) | | Total |
| Oil (Mbbls) | | Gas (Bcf) | | Oil (Mbbls) | | Gas (Bcf) |
Proved Reserves: | | | | | | | |
Fiscal year beginning balance | 9,190.0 |
| | 0.4 |
| | 9,190.0 |
| | 0.4 |
|
Extensions and discoveries | 186.4 |
| | — |
| | 186.4 |
| | — |
|
Revision of previous estimates | (1,643.8 | ) | | 6.0 |
| | (1,643.8 | ) | | 6.0 |
|
Purchase of minerals in place | 1,246.8 |
| | 5.5 |
| | 1,246.8 |
| | 5.5 |
|
Production | (74.2 | ) | | (0.4 | ) | | (74.2 | ) | | (0.4 | ) |
Fiscal year ended June 30, 2012 | 8,905.2 |
| | 11.5 |
| | 8,905.2 |
| | 11.5 |
|
Revision of previous estimates | (1,215.7 | ) | | 0.2 |
| | (1,215.7 | ) | | 0.2 |
|
Production | (320.9 | ) | | (0.3 | ) | | (320.9 | ) | | (0.3 | ) |
Fiscal year ended June 30, 2013 | 7,368.6 |
| | 11.4 |
| | 7,368.6 |
| | 11.4 |
|
| | | | | | | |
Proved Developed Reserves: | | | | | | | |
Fiscal year ended June 30, 2012 | 1,646.7 |
| | 11.5 |
| | 1,646.7 |
| | 11.5 |
|
Fiscal year ended June 30, 2013 | 1,581.5 |
| | 11.4 |
| | 1,581.5 |
| | 11.4 |
|
| | | | | | | |
Proved Undeveloped Reserves: | | | | | | | |
Fiscal year ended June 30, 2012 | 7,258.4 |
| | — |
| | 7,258.4 |
| | — |
|
Fiscal year ended June 30, 2013 | 5,787.2 |
| | — |
| | 5,787.2 |
| | — |
|
(1) The amount of proved reserves applicable to Australia gas reflects the amount of gas committed to specific long term supply contracts.
Extensions and discoveries. Extensions and discoveries are additions to reserve amounts either by drilling a well to extend the limits of a known reservoir or by drilling a well in a reservoir that was not included in previous reserve estimates, respectively. During the year ended June 30, 2012, in the US, there was one discovery well, EPU 117, drilled in the Amsden formation at Poplar, which added 186 Mbbls to our reserves total.
Revision of previous estimates. Revisions of estimates represent upward (downward) changes in previous estimates attributable to new information gained primarily from development activity, production history, and changes to the economic conditions present at the time of each estimate. During the year ended June 30, 2013, in the US, there was a 1,216 Mbbls downward revision of estimates related to the removal from the reserves projections of four PUD wells to be drilled during calendar year 2015. These wells were removed because the Company determined it would be beneficial to use only one as opposed to two drilling rigs for its PUD drilling program, and, as a result, it would not be feasible to drill these four wells within the projected time frame. During the year ended June 30, 2013, in Australia, there were immaterial revisions of estimates related to minor variances in projections relative to the prior year. During the year ended June 30, 2012, in the US, there was a 1,644 Mbbls downward revision of estimates as a result of modifications to projected production profiles from new wells.
During the same period in Australia, there was a 6.0 Bcf upward revision of gas estimates related to the signing of a new gas sales contract with Santos in May 2012.
Purchase of minerals in place. During the year ended June 30, 2012, in the US, there were 1,247 Mbbls of purchases of minerals in place related to the Company's consolidation of its ownership in NP and Poplar in September 2011. During the same period in Australia, there were 5.5 Bcf of purchases of minerals in place related to the consolidation of Magellan's ownership in Palm Valley as part of the Santos SA in the Amadeus Basin completed in May 2012. These minerals in place have been recorded as proved reserves because they have been contracted for sale under the Palm Valley GSPA.
Sales of minerals in place. There were no adjustments to reserves quantities relating to sales of minerals in place for the years ended June 30, 2013, and 2012.
Standardized Measure of Oil and Gas
The Company computes a standardized measure of future net cash flows and changes therein relating to estimated proved reserves in accordance with authoritative accounting guidance. Certain information concerning the assumptions used in computing the valuation of proved reserves and their inherent limitations are discussed below. The Company believes such information is essential for a proper understanding and assessment of the data presented.
The "standardized measure" is the present value of estimated future cash inflows from proved oil and natural gas reserves, less future development and production costs and future income tax expenses, using prices and costs as of the date of estimation without future escalation, without giving effect to hedging activities, non-property related expenses such as general and administrative expenses, debt service, depreciation, depletion, and amortization, and tax, and are discounted using an annual discount rate of 10% to reflect timing of future cash flows.
The assumptions used to calculate estimated future cash inflows do not necessarily reflect the Company's expectations of actual revenues or costs, nor their present worth. In addition, variations from the expected production rate also could result directly or indirectly from factors outside of the Company's control, such as unexpected delays in development, changes in prices, or regulatory or environmental policies. The reserve valuation further assumes that all reserves will be disposed of by production. However, if reserves are sold in place, additional economic considerations could also affect the amount of cash eventually realized.
Prices. All prices used in calculation of our reserves are based upon a twelve month unweighted arithmetic average of the first day of the month price for the twelve months of the fiscal year, unless prices were defined by contractual arrangements. Prices are adjusted for local differentials and gravity and, as required by the SEC, held constant for the life of the projects (i.e., no escalation). The resulting prices used for proved reserves for the fiscal year ended June 30, 2013 are:
|
| | | |
| United States | | Australia |
Oil (per Bbl) | $82.90 | | NA |
Gas (per Mcf) | NA | | $4.92 |
Costs. Future development and production costs are calculated by estimating the expenditures to be incurred in developing and producing the proved oil and gas reserves at the end of the year, based on year-end costs and assuming continuation of existing economic conditions.
Income taxes. Future income tax expenses are calculated by applying the appropriate year-end statutory tax rates, with consideration of future tax rates already legislated, to the future pre-tax net cash flows relating to the Company's proved oil and gas reserves. Permanent differences in oil and gas related tax credits and allowances are recognized.
Discount. The present value of future net cash flows from the Company's proved reserves is calculated using a 10% annual discount rate. This rate is not necessarily the same as that used to calculate the current market value of our estimated oil and natural gas reserves.
The following table presents the standardized measure of discounted future net cash flows related to proved oil and gas reserves:
|
| | | | | | | | | | | |
| United States | | Australia | | Total |
| (In thousands) |
Fiscal year ended June 30, 2013 | | | | | |
Future cash inflows | $ | 610,853 |
| | $ | 55,947 |
| | $ | 666,800 |
|
Future production costs | (244,703 | ) | | (38,576 | ) | | (283,279 | ) |
Future development costs | (28,922 | ) | | (4,095 | ) | | (33,017 | ) |
Future income tax expense | (112,193 | ) | | — |
| | (112,193 | ) |
Future net cash flows | 225,035 |
| | 13,276 |
| | 238,311 |
|
10% annual discount | (127,644 | ) | | (2,991 | ) | | (130,635 | ) |
Standardized measures of discounted future net cash flows | $ | 97,391 |
| | $ | 10,285 |
| | $ | 107,676 |
|
|
| | | | | | | | | | | |
| United States | | Australia | | Total |
| (In thousands) |
Fiscal year ended June 30, 2012 | | | | | |
Future cash inflows | $ | 756,405 |
| | $ | 53,296 |
| | $ | 809,701 |
|
Future production costs | (291,212 | ) | | (34,729 | ) | | (325,941 | ) |
Future development costs | (34,416 | ) | | (4,107 | ) | | (38,523 | ) |
Future income tax expense | (152,314 | ) | | (3,667 | ) | | (155,981 | ) |
Future net cash flows | 278,463 |
| | 10,793 |
| | 289,256 |
|
10% annual discount | (156,967 | ) | | (2,214 | ) | | (159,181 | ) |
Standardized measures of discounted future net cash flows | $ | 121,496 |
| | $ | 8,579 |
| | $ | 130,075 |
|
A summary of changes in the standardized measure of discounted future net cash flows is as follows:
|
| | | | | | | | | | | |
| United States | | Australia | | Total |
| (In thousands) |
Fiscal year beginning balance | $ | 110,016 |
| | $ | 264 |
| | $ | 110,280 |
|
Net change in prices and production costs | 18,517 |
| | — |
| | 18,517 |
|
Extensions and discoveries | 6,785 |
| | — |
| | 6,785 |
|
Acquisitions of reserves | 26,584 |
| | 4,872 |
| | 31,456 |
|
Revisions of previous quantity estimates | (37,846 | ) | | 6,144 |
| | (31,702 | ) |
Changes in estimated future development costs | (2,275 | ) | | (555 | ) | | (2,830 | ) |
Sales and transfers of oil and gas produced | (941 | ) | | (264 | ) | | (1,205 | ) |
Previously estimated development cost incurred during the period | 5,841 |
| | — |
| | 5,841 |
|
Accretion of discount (1) | — |
| | — |
| | — |
|
Net change in income taxes | (1,657 | ) | | (1,576 | ) | | (3,233 | ) |
Net change in timing and other | (3,528 | ) | | (306 | ) | | (3,834 | ) |
Fiscal year ended June 30, 2012 | 121,496 |
| | 8,579 |
| | 130,075 |
|
Net change in prices and production costs | (7,955 | ) | | (624 | ) | | (8,579 | ) |
Revisions of previous quantity estimates | (26,503 | ) | | 192 |
| | (26,311 | ) |
Changes in estimated future development costs | 3,473 |
| | 5 |
| | 3,478 |
|
Sales and transfers of oil and gas produced | (20,178 | ) | | 556 |
| | (19,622 | ) |
Previously estimated development cost incurred during the period | 3,419 |
| | 7 |
| | 3,426 |
|
Accretion of discount | 19,269 |
| | 1,016 |
| | 20,285 |
|
Net change in income taxes | 22,258 |
| | 1,577 |
| | 23,835 |
|
Net change in timing and other (2) | (17,888 | ) | | (1,023 | ) | | (18,911 | ) |
Fiscal year ended June 30, 2013 | $ | 97,391 |
| | $ | 10,285 |
| | $ | 107,676 |
|
(1) For fiscal year 2012, the Company assumed no accretion in value of proved oil reserves in the US and Australia. Accretion, with respect to measuring the changes in the standardized measure of reserves values, represents the value benefit of being closer in time, relative to the prior fiscal year's standardized measure, to future cash flows in the reserve projections. During fiscal year 2012, in the US, the Company did not develop its US proved oil reserves in accordance with the reserve plans in place at the beginning of the year, but instead postponed such plans by one year. Therefore, the benefit of accretion of the prior fiscal year's reserves should not have factored into the value of the standardized measure for fiscal year 2012. During fiscal year 2012, in Australia, the reserves at the beginning of the year had been sold entirely during the fiscal year as the long term gas sales contract in place at Palm Valley expired by its term in January 2012. As such, accretion of prior year reserves was not relevant in this case.
(2) For fiscal year 2013, in the US, there was a $17,888 downward revision in reserves value due to changes in timing and other. This revision primarily relates to the change, relative to the prior year reserves projections, in the expected timing of drilling and completing PUD wells and the attendant cash flow expected from these wells. During fiscal year 2013, the Company focused its activities at Poplar on executing water shutoff treatments due to their potential attractive economics. As a result, PUDs previously estimated to be drilled during fiscal year 2013 were postponed, resulting in a change in the annual quantity and timing of PUD wells to be drilled in the current reserves projections.
Note 17 - Oil and Gas Activities (Unaudited)
Costs Incurred in Oil and Gas Producing Activities
Costs incurred in oil and gas property acquisition, exploration, and development activities, whether capitalized or expensed, are summarized as follows:
|
| | | | | | | | | | | | | | | |
| United States | | Australia | | United Kingdom | | Total |
| (In thousands) |
Fiscal year ended June 30, 2013 | | | | | | | |
Proved | $ | 3,399 |
| | $ | — |
| | $ | — |
| | $ | 3,399 |
|
Unproved | 157 |
| | 179 |
| | 335 |
| | 671 |
|
Exploration Costs | 398 |
| | 4,169 |
| | 3,700 |
| | 8,267 |
|
Development Costs | 2,045 |
| | — |
| | — |
| | 2,045 |
|
Total, including asset retirement obligation | $ | 5,999 |
| | $ | 4,348 |
| | $ | 4,035 |
| | $ | 14,382 |
|
| | | | | | | |
Fiscal year ended June 30, 2012 | | | | | | | |
Proved | $ | 1,606 |
| | $ | 5,634 |
| | $ | — |
| | $ | 7,240 |
|
Unproved | 945 |
| | 3,787 |
| | — |
| | 4,732 |
|
Exploration Costs | 2,192 |
| | 1 |
| | 5 |
| | 2,198 |
|
Development Costs | 2,779 |
| | — |
| | — |
| | 2,779 |
|
Total, including asset retirement obligation | $ | 7,522 |
| | $ | 9,422 |
| | $ | 5 |
| | $ | 16,949 |
|
Net Changes in Capitalized Costs
The net changes in capitalized costs that are currently not being depleted pending the determination of proved reserves can be summarized as follows:
|
| | | | | | | | | | | | | | | |
| United States | | Australia | | United Kingdom | | Total |
| (In thousands) |
Fiscal year ended June 30, 2013 | | | | | | | |
Fiscal year beginning balance | $ | 1,823 |
| | $ | 4,388 |
| | $ | 4,624 |
| | $ | 10,835 |
|
Additions to capitalized costs | 1,954 |
| | — |
| | 335 |
| | 2,289 |
|
Reclassified to producing properties | (3,223 | ) | | — |
| | — |
| | (3,223 | ) |
Charged to expense | (57 | ) | | — |
| | (3,035 | ) | | (3,092 | ) |
Exchange adjustment | — |
| | (412 | ) | | (162 | ) | | (574 | ) |
Fiscal year closing balance | $ | 497 |
| | $ | 3,976 |
| | $ | 1,762 |
| | $ | 6,235 |
|
| | | | | | | |
Fiscal year ended June 30, 2012 | | | | | | | |
Fiscal year beginning balance | $ | 2,411 |
| | $ | 415 |
| | $ | 5,259 |
| | $ | 8,085 |
|
Additions to capitalized costs | 4,631 |
| | 3,973 |
| | 1,369 |
| | 9,973 |
|
Assets sold or held for sale | (150 | ) | | — |
| | — |
| | (150 | ) |
Reclassified to producing properties | (3,772 | ) | | — |
| | — |
| | (3,772 | ) |
Charged to expense | (1,297 | ) | | — |
| | (2,106 | ) | | (3,403 | ) |
Exchange adjustment | — |
| | — |
| | 102 |
| | 102 |
|
Fiscal year closing balance | $ | 1,823 |
| | $ | 4,388 |
| | $ | 4,624 |
| | $ | 10,835 |
|
During the third quarter of fiscal year 2013, the Company allowed a petroleum exploration and development license in the UK to expire at the end of its term. As a result, an impairment of $0.9 million was recorded in the consolidated statements of operations. Additionally, the Company recorded a write-down related to the Markwells Wood-1 exploration well in the UK operated by Northern Petroleum. As a result, an exploration expense of $2.2 million was recorded in the consolidated statements of operations. No further write-downs were recorded during the fiscal year ended June 30, 2013.
At June 30, 2013, the Company had no costs capitalized for exploratory wells in progress for a period of greater than one year after the completion of drilling.
Note 18 - Quarterly Financial Data (Unaudited)
The following table summarizes the unaudited quarterly financial data, including (loss) income before income taxes, net (loss) income, and net (loss) income per common share for the fiscal years ended:
|
| | | | | | | | | | | | | | | | | | | |
| First Quarter | | Second Quarter | | Third Quarter | | Fourth Quarter | | June 30,
2013 |
| (In thousands, except per share data) |
Fiscal year ended June 30, 2013 | | | | | | | | | |
Total operating revenues | $ | 1,660 |
| | $ | 1,748 |
| | $ | 1,937 |
| | $ | 1,725 |
| | $ | 7,070 |
|
Total operating expenses | $ | 7,542 |
| | $ | 9,485 |
| | $ | 7,303 |
| | $ | 5,227 |
| | $ | 29,557 |
|
Loss before income taxes | $ | (5,646 | ) | | $ | (7,606 | ) | | $ | (4,653 | ) | | $ | (3,128 | ) | | $ | (21,033 | ) |
Net loss | $ | (5,310 | ) | | $ | (7,285 | ) | | $ | (4,332 | ) | | $ | (2,840 | ) | | $ | (19,767 | ) |
| | | | | | | | | |
Net loss per basic common share outstanding | $(0.10) | | $(0.14) | | $(0.09) | | $(0.08) | | $(0.41) |
Net loss per diluted common share outstanding | $(0.10) |
| | $(0.14) | | $(0.09) | | $(0.08) | | $(0.41) |
|
| | | | | | | | | | | | | | | | | | | |
| First Quarter | | Second Quarter | | Third Quarter | | Fourth Quarter | | June 30, 2012 |
| (In thousands, except per share data) |
Fiscal year ended June 30, 2012 | | | | | | | | | |
Total operating revenues | $ | 3,735 |
| | $ | 3,202 |
| | $ | 4,805 |
| | $ | 1,970 |
| | $ | 13,712 |
|
Total operating expenses (income) | $ | 2,883 |
| | $ | 8,076 |
| | $ | 9,367 |
| | $ | (26,388 | ) | | $ | (6,062 | ) |
Income (loss) before income taxes | $ | 1,123 |
| | $ | (4,755 | ) | | $ | (4,590 | ) | | $ | 28,754 |
| | $ | 20,532 |
|
Net income (loss) | $ | 940 |
| | $ | (4,557 | ) | | $ | (4,590 | ) | | $ | 34,705 |
| | $ | 26,498 |
|
| | | | | | | | | |
Net income (loss) per basic common share outstanding | $0.02 | | $(0.08) | | $(0.09) | | $0.64 |
| | $0.49 |
|
Net income (loss) per diluted common share outstanding | $0.02 | | $(0.08) | | $(0.09) | | $0.64 |
| | $0.49 |
|
During the fourth quarter of fiscal year 2012, Magellan, through its wholly owned subsidiary MPA, completed the Santos SA (see Note 2) and became the sole owner of the Palm Valley Interests and of the Dingo Interests, while Santos became the sole owner of the Mereenie Interests. The transaction resulted in a gain on sale of assets in the amount of $36.2 million.
ITEM 9: CHANGES IN, AND DISAGREEMENTS WITH, ACCOUNTANTS ON ACCOUNTING AND FINANCIAL DISCLOSURE
None.
ITEM 9A: CONTROLS AND PROCEDURES
EVALUATION OF DISCLOSURE CONTROLS AND PROCEDURES
We maintain a system of disclosure controls and procedures that are designed to reasonably ensure that information required to be disclosed in our SEC reports is recorded, processed, summarized, and reported within the time periods specified in the SEC's rules and forms and to reasonably ensure that such information is accumulated and communicated to our management, including the Chief Executive Officer and the Chief Financial Officer, as appropriate, to allow for timely decisions regarding required disclosure.
The effectiveness of our disclosure controls and procedures and our internal control over financial reporting is subject to various inherent limitations, including resource constraints and judgments about the expected benefits of control alternatives relative to their costs, assumptions about the likelihood of future events, the possibility of human error, and the risk of fraud. Moreover, projections of any evaluation of effectiveness to future periods are subject to the risk that controls may become inadequate because of changes in conditions and the risk that the degree of compliance with policies or procedures may deteriorate over time. Because of these limitations, there can be no assurance that any system of disclosure controls and procedures or internal control over financial reporting will be successful in preventing all errors or fraud or in making all material information known in a timely manner to the appropriate levels of management.
An evaluation of the effectiveness of the design and operation of our Disclosure Controls was performed as of the end of the period covered by this report. This evaluation was performed under the supervision and with the participation of our management, including our Chief Executive Officer and Chief Financial Officer. Based upon that evaluation, our Chief Executive Officer and Chief Financial Officer concluded that these Disclosure Controls are effective.
MANAGEMENT'S ANNUAL REPORT ON INTERNAL CONTROL OVER FINANCIAL REPORTING
Management of the Company is responsible for establishing and maintaining adequate internal control over financial reporting as defined in Rules 13a-15(f) and 15d-15(f) under the Securities Exchange Act of 1934, as amended. The Company's internal control over financial reporting is designed to provide reasonable assurance regarding the reliability of financial reporting and the preparation of financial statements for external purposes in accordance with generally accepted accounting principles. The Company's internal control over financial reporting includes those policies and procedures that:
| |
• | pertain to the maintenance of records that, in reasonable detail, accurately and fairly reflect the transactions and dispositions of the assets of the Company; |
| |
• | provide reasonable assurance that transactions are recorded as necessary to permit preparation of financial statements in accordance with generally accepted accounting principles and that receipts and expenditures of the Company are being made only in accordance with authorizations of management and directors of the Company; and |
| |
• | provide reasonable assurance regarding prevention or timely detection of unauthorized acquisition, use, or disposition of the Company's assets that have a material effect on the financial statements. |
Management assessed the effectiveness of the Company's internal control over financial reporting as of June 30, 2013. In making this assessment, management used the criteria set forth by the Committee of Sponsoring Organizations of the Treadway Commission in Internal Control-Integrated Framework
Based on our assessment and these criteria, we believe that internal control over financial reporting is effective as of June 30, 2013.
This annual report does not include an attestation report of the company's registered public accounting firm regarding internal control over financial reporting. Our internal controls over financial reporting were not subject to attestation by the Company's registered public accounting firm pursuant to rules of the SEC that permit the Company to provide only management's report in this annual report.
CHANGE IN INTERNAL CONTROL OVER FINANCIAL REPORTING
There have not been any changes in the Company's internal control over financial reporting (as such term is defined in Rules 13a-15(f) and 15d-15(f) under the Exchange Act) during the fourth fiscal quarter of the Company's fiscal year ended June 30, 2013, that have materially affected, or are reasonably likely to materially affect, the Company's internal control over financial reporting.
ITEM 9B: OTHER INFORMATION
Not applicable.
PART III
Pursuant to General Instruction G(3), the information called for by Items 10, (except for information concerning the executive officers of the Company) 11, 12, 13, and 14 is hereby incorporated by reference to the Company's definitive proxy statement for the 2013 annual meeting of stockholders to be filed within 120 days from June 30, 2013. Certain information concerning the executive officers of the Company is included under Item 10: Directors, Executive Officers, and Corporate Governance of this report.
ITEM 10: DIRECTORS, EXECUTIVE OFFICERS, AND CORPORATE GOVERNANCE
The following table sets forth the names, ages, and positions held by the Company's executive officers. The ages of our executive officers are listed as of September 16, 2013.
|
| | | | | | |
Name | | Age | | Office Held | | Length of Service as Officer |
J. Thomas Wilson | | 61 | | President and Chief Executive Officer | | Since September 2011 |
Antoine J. Lafargue | | 39 | | VP - Chief Financial Officer and Treasurer | | Since August 2010 |
C. Mark Brannum | | 47 | | VP - General Counsel and Secretary | | Since September 2012 |
For further information regarding the named executive officers, see the Company's definitive proxy statement for the 2013 annual meeting of stockholders to be filed within 120 days from June 30, 2013.
ITEM 11: EXECUTIVE COMPENSATION
The information required by this Item is incorporated by reference to the information provided in the Company's definitive proxy statement for the 2013 annual meeting of stockholders to be filed within 120 days from June 30, 2013.
ITEM 12: SECURITY OWNERSHIP OF CERTAIN BENEFICIAL OWNERS AND MANAGEMENT AND RELATED STOCKHOLDER MATTERS
The information required by this Item is incorporated by reference to the information provided in the Company's definitive proxy statement for the 2013 annual meeting of stockholders to be filed within 120 days from June 30, 2013.
ITEM 13: CERTAIN RELATIONSHIPS AND RELATED TRANSACTIONS, AND DIRECTOR INDEPENDENCE
The information required by this Item is incorporated by reference to the information provided in the Company's definitive proxy statement for the 2013 annual meeting of stockholders to be filed within 120 days from June 30, 2013.
ITEM 14: PRINCIPAL ACCOUNTING FEES AND SERVICES
The information required by this Item is incorporated by reference to the information provided in the Company's definitive proxy statement for the 2013 annual meeting of stockholders to be filed within 120 days from June 30, 2013.
PART IV
ITEM 15: EXHIBITS AND FINANCIAL STATEMENT SCHEDULES
(a)(1) and (a)(2) Financial Statements and Financial Statement Schedules:
|
| |
ITEM | PAGE |
Report of Independent Registered Public Accounting Firm | |
Consolidated Balance Sheets | |
Consolidated Statements of Operations | |
Consolidated Statements of Comprehensive Income (Loss) | |
Consolidated Statements of Stockholders’ Equity | |
Consolidated Statements of Cash Flows | |
Notes to Consolidated Financial Statements | |
All schedules are omitted because the required information is not applicable or is not present in amounts sufficient to require submission of the schedule or because the information required is included in the consolidated financial statements and notes thereto.
(b) Exhibits. The following exhibits are filed or furnished with or incorporated by reference into this report on Form 10-K:
|
| |
EXHIBIT | |
NUMBER | DESCRIPTION |
2.1 | Lease Purchase and Sale and Participation Agreement among Magellan Petroleum Corporation, Nautilus Poplar LLC, and VAALCO Energy (USA), Inc., dated as of September 6, 2011 (filed as Exhibit 2.1 to the registrant's Quarterly Report on Form 10-Q filed on November 14, 2011 and incorporated herein by reference) |
2.2 | Amendment dated December 11, 2012 to Lease Purchase and Sale and Participation Agreement among Magellan Petroleum Corporation, Nautilus Poplar LLC, and VAALCO Energy (USA) Inc. dated as of September 6, 2011 (filed as Exhibit 2.1 to the registrant's Quarterly Report on Form 10-Q filed on February 11, 2013 and incorporated herein by reference) |
2.3 | Purchase and Sale Agreement among Magellan Petroleum Corporation and the members of Nautilus Technical Group LLC and Eastern Rider LLC, dated as of September 2, 2011 (filed as Exhibit 2.2 to the registrant's Quarterly Report on Form 10-Q filed on November 14, 2011 and incorporated herein by reference) |
2.4 | Sale Agreement among Magellan Petroleum (NT) Pty Ltd, Santos QNT Pty Ltd, and Santos Limited, dated September 14, 2011 (filed as Exhibit 2.3 to the registrant's Quarterly Report on Form 10-Q filed on November 14, 2011 and incorporated herein by reference) |
3.1 | Restated Certificate of Incorporation as filed on May 4, 1987 with the State of Delaware, as amended by an Amendment of Article Twelfth as filed on February 12, 1988 with the State of Delaware (filed as Exhibit 4.B. to the registrant's Registration Statement on Form S-8 filed on January 14, 1999 (Registration No. 333-70567) and incorporated herein by reference) |
3.2 | Certificate of Amendment of Restated Certificate of Incorporation as filed on December 26, 2000 with the State of Delaware (filed as Exhibit 3(a) to the registrant's Quarterly Report on Form 10-Q filed on February 13, 2001 and incorporated herein by reference) |
3.3 | Certificate of Amendment of Restated Certificate of Incorporation related to Articles Twelfth and Fourteenth as filed on October 15, 2009 with the State of Delaware (filed as Exhibit 3.3 to the registrant's Quarterly Report on Form 10-Q filed on February 16, 2010 and incorporated herein by reference) |
3.4 | Certificate of Amendment to Restated Certificate of Incorporation related to Article Thirteenth as filed on October 15, 2009 with the State of Delaware (filed as Exhibit 3.4 to the registrant's Quarterly Report on Form 10-Q filed on February 16, 2010 and incorporated herein by reference) |
3.5 | Certificate of Amendment of Restated Certificate of Incorporation related to Article Fourth as filed on December 10, 2010 with the State of Delaware (filed as Exhibit 3.1 to the registrant's Current Report on Form 8-K filed on December 13, 2010 and incorporated herein by reference) |
3.6 | Certificate of Designations of Series A Convertible Preferred Stock as filed on May 17, 2013 with the State of Delaware (filed as Exhibit 3.6 to the registrant's Current Report on Form 8-K filed on June 26, 2013 and incorporated herein by reference) |
3.7 | Certificate of Amendment to Certificate of Designations of Series A Convertible Preferred Stock as filed on August 19, 2013 with the State of Delaware (filed as Exhibit 3.1 to the registrant's Current Report on Form 8-K filed on August 19, 2013 and incorporated herein by reference) |
3.8 | By-Laws, as amended on June 13, 2013 (filed as Exhibit 3.1 to the registrant's Current Report on Form 8-K filed on June 18, 2013 and incorporated herein by reference) |
|
| |
4.1+ | Registration Rights Agreement dated May 17, 2013 between Magellan Petroleum Corporation and One Stone Holdings II LP (filed as Exhibit 4.1 to the registrant's Current Report on Form 8-K filed on June 26, 2013 and incorporated herein by reference) |
10.1 | Petroleum Lease No. 4 dated November 18, 1981 granted by the Northern Territory of Australia to United Canso Oil & Gas Co. (N.T.) Pty Ltd. (filed as Exhibit 10(a) to the registrant's Annual Report on Form 10-K for the fiscal year ended June 30, 1999 and incorporated herein by reference) |
10.2 | Petroleum Lease No. 5 dated November 18, 1981 granted by the Northern Territory of Australia to Magellan Petroleum (N.T.) Pty. Ltd. (filed as Exhibit 10(b) to the registrant's Annual Report on Form 10-K for the fiscal year ended June 30, 1999 and incorporated herein by reference) |
10.3 | Palm Valley Petroleum Lease (OL3) dated November 9, 1982 (filed as Exhibit 10(d) to the registrant's Annual Report on Form 10-K for the fiscal year ended June 30, 1999 and incorporated herein by reference) |
10.4 | Palm Valley Operating Agreement dated April 2, 1985 among Magellan Petroleum (N.T.) Pty. Ltd., C.D. Resources Pty. Ltd., Farmout Drillers N.L., Canso Resources Limited, International Oil Proprietary, Pancontinental Petroleum Limited, I.E.D.C. Australia Pty. Ltd., Southern Alloys Ventures Pty. Limited, and Amadeus Oil N.L. (filed as Exhibit 10(f) to the registrant's Annual Report on Form 10-K for the fiscal year ended June 30, 1999 and incorporated herein by reference) |
10.5 | Mereenie Operating Agreement dated April 27, 1984 among Magellan Petroleum (N.T.) Pty. Ltd., United Oil & Gas Co. (N.T.) Pty. Ltd., Canso Resources Limited, Oilmin (N.T.) Pty. Ltd., Krewliff Investments Pty. Ltd., Transoil (N.T.) Pty. Ltd., and Farmout Drillers NL, and Amendment thereto dated October 3, 1984 (filed as Exhibit 10(g) to the registrant's Annual Report on Form 10-K for the fiscal year ended June 30, 1999 and incorporated herein by reference) |
10.6 | Palm Valley Gas Purchase Agreement dated June 28, 1985 among Magellan Petroleum (N.T.) Pty. Ltd., C.D. Resources Pty. Ltd., Farmout Drillers N.L., Canso Resources Limited, International Oil Proprietary, Pancontinental Petroleum Limited, IEDC Australia Pty Limited, Amadeus Oil N.L., Southern Alloy Venture Pty. Limited, and Gasgo Pty. Limited, including the Guarantee of the Northern Territory of Australia dated June 28, 1985 and the Certification Letter dated June 28, 1985 that the Guarantee is binding (filed as Exhibit 10(h) to the registrant's Annual Report on Form 10-K for the fiscal year ended June 30, 1999 and incorporated herein by reference) |
10.7 | Agreements dated June 28, 1985 relating to the Amadeus Basin - Darwin Pipeline, including a Deed of Trust related to Amadeus Gas Trust, an Undertaking by the Northern Territory Electric Commission, and an Undertaking from the Northern Territory Gas Pty Ltd. (filed as Exhibit 10(j) to the registrant's Annual Report on Form 10-K for the fiscal year ended June 30, 1999 and incorporated herein by reference) |
10.8 | Agreement among the Mereenie Producers and the Palm Valley Producers dated June 28, 1985 (filed as Exhibit 10(k) to the registrant's Annual Report on Form 10-K for the fiscal year ended June 30, 1999 and incorporated herein by reference) |
10.9 | Palm Valley Renewal of Petroleum Lease dated November 6, 2003 (filed as Exhibit 10(s) to the registrant's Annual Report on Form 10-K for the fiscal year ended June 30, 2004 and incorporated herein by reference) |
10.10+ | Form of Indemnification Agreement between Magellan Petroleum Corporation and directors and officers pursuant to Article Sixteenth of the Restated Certificate of Incorporation and the By-Laws (filed as Exhibit 10.1 to the registrant's Current Report on Form 8-K filed on June 2, 2009 and incorporated herein by reference) |
10.11+ | Form of Indemnification Agreement for directors and officers (filed as Exhibit 10.1 to the registrant's Current Report on Form 8-K filed on June 10, 2013 and incorporated herein by reference) |
10.12+ | 1998 Stock Option Plan (filed as Exhibit 4.A. to the registrant's Registration Statement on Form S-8 filed on January 14, 1999 (Registration No. 333-70567) and incorporated herein by reference) |
10.13+ | First Amendment to the 1998 Stock Option Plan dated October 24, 2007 (filed as Exhibit 10(n) to the registrant's Annual Report on Form 10-K for the fiscal year ended June 30, 2008 and incorporated herein by reference) |
10.14+ | 1998 Stock Incentive Plan, as amended and restated through September 28, 2010 (filed as Exhibit 10.1 to the registrant's Current Report on Form 8-K filed on December 13, 2010 and incorporated herein by reference) |
10.15+
| Form of Non-Qualified Stock Option Award Agreement between Magellan Petroleum Corporation and officers and directors (filed as Exhibit 10.1 to the registrant's Current Report on Form 8-K filed on November 30, 2005 and incorporated herein by reference) |
10.16+ | Form of Amendment to Non-Qualified Stock Option Agreement between Magellan Petroleum Corporation and directors (filed as Exhibit 10.2 to the registrant's Current Report on Form 8-K filed on December 15, 2008 and incorporated herein by reference) |
10.17+ | Employment Agreement between Magellan Petroleum Corporation and William H. Hastings, dated as of February 3, 2009 (filed as Exhibit 10.1 to the registrant's Current Report on Form 8-K filed on February 9, 2009 and incorporated herein by reference) |
10.18+ | Indemnification Agreement between Magellan Petroleum Corporation and William H. Hastings, dated as of February 3, 2009 (filed as Exhibit 10.2 to the registrant's Current Report on Form 8-K filed on February 9, 2009 and incorporated herein by reference) |
10.19+ | Non-Qualified Stock Option Award Agreement between Magellan Petroleum Corporation and William H. Hastings, dated as of February 3, 2009 (filed as Exhibit 10.3 to the registrant's Current Report on Form 8-K filed on February 9, 2009 and incorporated herein by reference) |
10.20+ | Non-Qualified Stock Option Performance Award Agreement between Magellan Petroleum Corporation and William H. Hastings, dated as of February 3, 2009 (filed as Exhibit 10.4 to the registrant's Current Report on Form 8-K filed on February 9, 2009 and incorporated herein by reference) |
10.21+ | Employment Agreement Addendum between Magellan Petroleum Corporation and William H. Hastings, dated as of September 27, 2011 (filed as Exhibit 10.1 to the registrant's Current Report on Form 8-K filed on October 3, 2011 and incorporated herein by reference) |
|
| |
10.22 | Warrant Agreement between Magellan Petroleum Corporation and Young Energy Prize S.A., dated July 9, 2009 (filed as Exhibit 10.1 to the registrant's Current Report on Form 8-K filed on July 14, 2009 and incorporated herein by reference) |
10.23 | Amended and Restated Warrant Agreement between Magellan Petroleum Corporation and Young Energy Prize S.A., dated March 11, 2010 (filed as Exhibit 10.1 to the registrant's Quarterly Report on Form 10-Q filed on May 14, 2010 and incorporated herein by reference) |
10.24 | Registration Rights Agreement between Magellan Petroleum Corporation and Young Energy Prize S.A., dated July 9, 2009 (filed as Exhibit 10.2 to the registrant's Current Report on Form 8-K filed on July 14, 2009 and incorporated herein by reference) |
10.25 | First Amendment to Registration Rights Agreement among Magellan Petroleum Corporation, Young Energy Prize S.A., and YEP I, SICAV-FIS, dated as of October 14, 2009 (filed as Exhibit 10.2 to the registrant's Current Report on Form 8-K filed on October 19, 2009 and incorporated herein by reference) |
10.26 | Second Amendment to Registration Rights Agreement among Magellan Petroleum Corporation, Young Energy Prize S.A., and ECP Fund, SICAV-FIS, dated June 23, 2010 (filed as Exhibit 10(xx) to the registrant's Annual Report on Form 10-K for the fiscal year ended June 30, 2010 and incorporated herein by reference) |
10.27+ | Consulting Agreement between Magellan Petroleum Corporation and J. Thomas Wilson, dated July 9, 2009 (filed as Exhibit 10.4 to the registrant's Current Report on Form 8-K filed on July 14, 2009 and incorporated herein by reference) |
10.28+ | Non-Qualified Stock Option Award Agreement between Magellan Petroleum Corporation and J. Thomas Wilson, dated July 9, 2009 (filed as Exhibit 10.5 to the registrant's Current Report on Form 8-K filed on July 14, 2009 and incorporated herein by reference) |
10.29+ | Non-Qualified Stock Option Performance Award Agreement between Magellan Petroleum Corporation and J. Thomas Wilson, dated July 9, 2009 (filed as Exhibit 10.6 to the registrant's Current Report on Form 8-K filed on July 14, 2009 and incorporated herein by reference) |
10.30+ | Employment Agreement between Magellan Petroleum Corporation and J. Thomas Wilson dated November 2, 2011 (filed as Exhibit 10.1 to the registrant's Current Report on Form 8-K/A filed on November 16, 2011 and incorporated herein by reference) |
10.31+ | Amended and Restated Employment Agreement between Magellan Petroleum Corporation and J. Thomas Wilson dated November 12, 2012 (filed as Exhibit 10.4 to the registrant's Quarterly Report on Form 10-Q filed on February 11, 2013 and incorporated herein by reference) |
10.32+ | Indemnification Agreement between Magellan Petroleum Corporation and J. Thomas Wilson dated November 2, 2011 (filed as Exhibit 10.2 to the registrant's Current Report on Form 8-K/A filed on November 16, 2011 and incorporated herein by reference) |
10.33+ | Nonqualified Stock Option Award Agreement between Magellan Petroleum Corporation and J. Thomas Wilson dated November 16, 2011 (filed as Exhibit 10.3 to the registrant's Current Report on Form 8-K/A filed on November 16, 2011 and incorporated herein by reference) |
10.34+ | Restricted Stock Award Agreement between Magellan Petroleum Corporation and J. Thomas Wilson dated November 16, 2011 (filed as Exhibit 10.4 to the registrant's Current Report on Form 8-K/A filed on November 16, 2011 and incorporated herein by reference) |
10.35 | First Amended and Restated Operating Agreement of Nautilus Poplar, LLC among Nautilus Technical Group, LLC, White Bear, LLC, YEP I, SICAV-FIS, and Eastern Rider, LLC dated as of October 14, 2009 (filed as Exhibit 10.1 to the registrant's Current Report on Form 8-K filed on October 19, 2009 and incorporated herein by reference) |
10.36+ | Employment Agreement between Magellan Petroleum Corporation and Susan M. Filipos, dated as of September 28, 2009 (filed as Exhibit 10.1 to the registrant's Current Report on Form 8-K filed on May 7, 2010 and incorporated herein by reference) |
10.37+ | Employment Agreement between Magellan Petroleum Corporation and Susan M. Filipos, dated as of September 28, 2009, as amended on August 16, 2011 (filed as Exhibit 10.4 to the registrant's Quarterly Report on Form 10-Q filed on November 14, 2011 and incorporated herein by reference) |
10.38+ | Non-Qualified Stock Option Award Agreement between Magellan Petroleum Corporation and Susan M. Filipos, dated as of October 1, 2009 (filed as Exhibit 10.2 to the registrant's Current Report on Form 8-K filed on May 7, 2010 and incorporated herein by reference) |
10.39+ | Indemnification Agreement between Magellan Petroleum Corporation and Susan M. Filipos, dated as of May 3, 2010 (filed as Exhibit 10.3 to the registrant's Current Report on Form 8-K filed on May 7, 2010 and incorporated herein by reference) |
10.40 | Assets Sale Deed between Magellan Petroleum Australia Limited and Santos Offshore Pty Ltd., dated as of March 25, 2010 (filed as Exhibit 2.1 to the registrant's Quarterly Report on Form 10-Q filed on May 14, 2010 and incorporated herein by reference) |
10.41+ | Form of Non-Qualified Stock Option Award Agreement between Magellan Petroleum Corporation and non-employee directors, dated April 1, 2010 (filed as Exhibit 10.2 to the registrant's Quarterly Report on Form 10-Q filed on May 14, 2010 and incorporated herein by reference) |
10.42+ | Form of Restricted Stock Award Agreement between Magellan Petroleum Corporation and non-employee directors, dated April 1, 2010 (Version A) (filed as Exhibit 10.3 to the registrant's Quarterly Report on Form 10-Q filed on May 14, 2010 and incorporated herein by reference) |
10.43+ | Form of Restricted Stock Award Agreement between Magellan Petroleum Corporation and non-employee directors, dated April 1, 2010 (Version B) (filed as Exhibit 10.4 to the registrant's Quarterly Report on Form 10-Q filed on May 14, 2010 and incorporated herein by reference) |
|
| |
10.44+ | Employment Agreement between Magellan Petroleum Corporation and Antoine J. Lafargue, dated as of August 2, 2010 (filed as Exhibit 10.1 to the registrant's Current Report on Form 8-K filed on August 4, 2010 and incorporated herein by reference) |
10.45+ | Indemnification Agreement between Magellan Petroleum Corporation and Antoine J. Lafargue, dated as of August 2, 2010 (filed as Exhibit 10.2 to the registrant's Current Report on Form 8-K filed on August 4, 2010 and incorporated herein by reference) |
10.46+ | Non-Qualified Stock Option Award Agreement between Magellan Petroleum Corporation and Antoine J. Lafargue, dated as of August 2, 2010 (filed as Exhibit 10.3 to the registrant's Current Report on Form 8-K filed on August 4, 2010 and incorporated herein by reference) |
10.47+ | Non-Qualified Stock Option Performance Award Agreement between Magellan Petroleum Corporation and Antoine J. Lafargue, dated as of August 2, 2010 (filed as Exhibit 10.4 to the registrant's Current Report on Form 8-K filed on August 4, 2010 and incorporated herein by reference) |
10.48+ | Nonqualified Stock Option Award Agreement between Magellan Petroleum Corporation and Antoine J. Lafargue dated November 30, 2011 (filed as Exhibit 10.7 to the registrant's Quarterly Report on Form 10-Q filed on February 10, 2012 and incorporated herein by reference) |
10.49+ | Nonqualified Stock Option Performance Award Agreement between Magellan Petroleum Corporation and Antoine J. Lafargue dated November 30, 2011 (filed as Exhibit 10.8 to the registrant's Quarterly Report on Form 10-Q filed on February 10, 2012 and incorporated herein by reference) |
10.50 | Securities Purchase Agreement between Magellan Petroleum Corporation and Young Energy Prize S.A., dated August 5, 2010 (filed as Exhibit 10.1 to the registrant's Current Report on Form 8-K filed on August 11, 2010 and incorporated herein by reference) |
10.51 | Memorandum of Agreement between Magellan Petroleum Corporation and Young Energy Prize S.A., dated August 5, 2010 (filed as Exhibit 10.2 to the registrant's Current Report on Form 8-K filed on August 11, 2010 and incorporated herein by reference) |
10.52 | Investor Rights Agreement between Magellan Petroleum Corporation and Young Energy Prize S.A., dated August 5, 2010 (filed as Exhibit 10.3 to the registrant's Current Report on Form 8-K filed on August 11, 2010 and incorporated herein by reference) |
10.53 | Letter Deed dated December 23, 2010 between Magellan Petroleum Australia Limited and Santos Offshore Pty Ltd. (filed as Exhibit 10.1 to the registrant's Current Report on Form 8-K filed on December 28, 2010 and incorporated herein by reference) |
10.54 | Deed of Variation between Magellan Petroleum Australia Limited and Santos Offshore Pty Ltd. dated as of January 31, 2011 (filed as Exhibit 10.1 to the registrant's Quarterly Report on Form 10-Q filed on May 16, 2011 and incorporated herein by reference) |
10.55 | Letter of Young Energy Prize S.A. to Magellan Petroleum Corporation dated January 13, 2011, effective as of December 23, 2010 (filed as Exhibit 10.1 to the registrant's Current Report on Form 8-K filed on January 18, 2011 and incorporated herein by reference) |
10.56 | First Amendment to Securities Purchase Agreement between Magellan Petroleum Corporation and Young Energy Prize S.A., dated February 11, 2011 (filed as Exhibit 10.1 to the registrant's Current Report on Form 8-K filed on February 18, 2011 and incorporated herein by reference) |
10.57 | Second Amendment to Securities Purchase Agreement between Magellan Petroleum Corporation and Young Energy Prize S.A., dated February 17, 2011 (filed as Exhibit 10.2 to the registrant's Current Report on Form 8-K filed on February 18, 2011 and incorporated herein by reference) |
10.58 | Investment Agreement between Magellan Petroleum Corporation and Young Energy Prize S.A., dated February 11, 2011 (filed as Exhibit 10.3 to the registrant's Current Report on Form 8-K filed on February 18, 2011 and incorporated herein by reference) |
10.59 | Amended Side Letter to Investment Agreement between Magellan Petroleum Corporation and Young Energy Prize S.A., dated February 17, 2011 (filed as Exhibit 10.4 to the registrant's Current Report on Form 8-K filed on February 18, 2011 and incorporated herein by reference) |
10.60 | Release Agreement between Santos Offshore Party Ltd and Magellan Petroleum Australia Limited, dated as of July 21, 2011 (filed as Exhibit 10.1 to the registrant's Quarterly Report on Form 10-Q filed on November 14, 2011 and incorporated herein by reference) |
10.61 | Registration Rights Agreement among Magellan Petroleum Corporation and the members of Nautilus Technical Group LLC and Eastern Rider LLC, dated September 2, 2011 (filed as Exhibit 10.2 to the registrant's Quarterly Report on Form 10-Q filed on November 14, 2011 and incorporated herein by reference) |
10.62 | Gas Supply and Purchase Agreement among Magellan Petroleum (N.T.) Pty. Ltd., Santos Limited, and Santos QNT Pty. Ltd., dated September 14, 2011 (filed as Exhibit 10.3 to the registrant's Quarterly Report on Form 10-Q filed on November 14, 2011 and incorporated herein by reference) |
10.63+ | Offer Letter to Milam Randolph Pharo dated November 16, 2011 and accepted on November 30, 2011 (filed as Exhibit 10.5 to the registrant's Quarterly Report on Form 10-Q filed on February 10, 2012 and incorporated herein by reference) |
10.64+ | Nonqualified Stock Option Award and Subscription Agreement between Magellan Petroleum Corporation and Milam Randolph Pharo dated November 30, 2011 (filed as Exhibit 10.6 to the registrant's Quarterly Report on Form 10-Q filed on February 10, 2012 and incorporated herein by reference) |
10.65+ | Nonqualified Stock Option Award and Subscription Agreement between Magellan Petroleum Corporation and Blaine K. Spies dated December 14, 2011 (filed as Exhibit 10.9 to the registrant's Quarterly Report on Form 10-Q filed on February 10, 2012 and incorporated herein by reference) |
|
| |
10.66+ | Employment Agreement dated August 28, 2012 between Magellan Petroleum Corporation and C. Mark Brannum (filed as Exhibit 10.1 to the registrant's Quarterly Report on Form 10-Q/A filed on February 15, 2013 and incorporated herein by reference) |
10.67+ | Nonqualified Stock Option Award and Subscription Agreement dated August 28, 2012 between Magellan Petroleum Corporation and C. Mark Brannum (filed as Exhibit 10.2 to the registrant's Quarterly Report on Form 10-Q/A filed on February 15, 2013 and incorporated herein by reference) |
10.68+ | Restricted Stock Award and Subscription Agreement dated August 28, 2012 between Magellan Petroleum Corporation and C. Mark Brannum (filed as Exhibit 10.3 to the registrant's Quarterly Report on Form 10-Q/A filed on February 15, 2013 and incorporated herein by reference) |
10.69+ | Indemnification Agreement dated September 5, 2012 between Magellan Petroleum Corporation and C. Mark Brannum (filed as Exhibit 10.4 to the registrant's Quarterly Report on Form 10-Q/A filed on February 15, 2013 and incorporated herein by reference) |
10.70+ | Indemnification Agreement dated November 30, 2011 between Magellan Petroleum Corporation and Milam Randolph Pharo (filed as Exhibit 10.5 to the registrant's Quarterly Report on Form 10-Q/A filed on February 15, 2013 and incorporated herein by reference) |
10.71+ | Letter Agreement dated September 7, 2012 between Magellan Petroleum Corporation and Nikolay V. Bogachev (filed as Exhibit 10.6 to the registrant's Quarterly Report on Form 10-Q/A filed on February 15, 2013 and incorporated herein by reference) |
10.72 | Agreement for 2-D and 3-D Data Acquisition Services dated October 26, 2012 between Magellan Petroleum (Offshore) PTY LTD and Seabird Exploration FZ LLC (filed as Exhibit 10.7 to the registrant's Quarterly Report on Form 10-Q filed on November 9, 2012 and incorporated herein by reference) |
10.73+ | Collateral Purchase Agreement dated January 14, 2013 between Sopak AG and Magellan Petroleum Corporation (filed as Exhibit 10.1 to the registrant's Current Report on Form 8-K filed on January 17, 2013 and incorporated herein by reference) |
10.74+ | Magellan Petroleum Corporation 2012 Omnibus Incentive Compensation Plan (filed as Exhibit 10.2 to the registrant's Current Report on Form 8-K filed on January 17, 2013 and incorporated herein by reference) |
10.75*+ | Form of Restricted Stock Award Agreement under the 2012 Omnibus Incentive Compensation Plan |
10.76*+ | Form of Nonqualified Stock Option Award Agreement under the 2012 Omnibus Incentive Compensation Plan |
10.77+ | Series A Convertible Preferred Stock Purchase Agreement dated May 10, 2013 between Magellan Petroleum Corporation and One Stone Holdings II LP (filed as Exhibit 10.1 to the registrant's Current Report on Form 8-K filed on May 13, 2013 and incorporated herein by reference) |
14.1 | Code of Conduct of Magellan Petroleum Corporation, as amended July 24, 2012 (filed as Exhibit 14.1 to the registrant's Annual Report on Form 10-K filed on September 24, 2012 and incorporated herein by reference) |
21.1* | Subsidiaries of the Registrant |
23.1* | Consent of EKS&H LLLP |
23.2* | Consent of Allen & Crouch Petroleum Engineers Inc. |
23.3* | Consent of Ryder Scott Company, L.P. |
31.1* | Certification of Chief Executive Officer pursuant to Section 302 of the Sarbanes-Oxley Act of 2002 |
31.2* | Certification of Chief Financial Officer pursuant to Section 302 of the Sarbanes-Oxley Act of 2002 |
32.1** | Certification of Chief Executive Officer pursuant to 18 U.S.C. Section 1350, as adopted pursuant to Section 906 of the Sarbanes-Oxley Act of 2002 |
32.2** | Certification of Chief Financial Officer pursuant to 18 U.S.C. Section 1350, as adopted pursuant to Section 906 of the Sarbanes-Oxley Act of 2002 |
99.1* | Summary reserves report of Allen & Crouch Petroleum Engineers, Inc. |
99.2* | Summary reserves report of Ryder Scott Company, L.P. |
101.INS*** | XBRL Instance Document |
101.SCH*** | XBRL Taxonomy Extension Schema Document |
101.CAL*** | XBRL Taxonomy Extension Calculation Linkbase Document |
101.DEF*** | XBRL Taxonomy Extension Definition Linkbase Document |
101.LAB*** | XBRL Taxonomy Extension Label Linkbase Document |
101.PRE*** | XBRL Taxonomy Extension Presentation Linkbase Document |
| |
* | Filed herewith. |
** | Furnished herewith. |
*** | Furnished herewith. Users of this data submitted electronically herewith are advised pursuant to Rule 406T of Regulation S-T that this interactive data file is deemed not filed or part of a registration statement or prospectus for purposes of sections 11 or 12 of the Securities Act of 1933, is deemed not filed for purposes of section 18 of the Securities Exchange Act of 1934, and otherwise is not subject to liability under these sections. |
+ | Management contract or compensatory plan or arrangement. |
SIGNATURES
Pursuant to the requirements of Section 13 or 15(d) of the Securities Exchange Act of 1934, the registrant has duly caused this report to be signed on its behalf by the undersigned, thereunto duly authorized.
|
| | | | |
| | MAGELLAN PETROLEUM CORPORATION | |
| | (Registrant) | |
| | | | |
| | By: | /s/ J. Thomas Wilson | |
| | | John Thomas Wilson, President and Chief Executive Officer | |
| | | (as Principal Executive Officer) | |
| | | | |
| | By: | /s/ Antoine J. Lafargue | |
| | | Antoine J. Lafargue, Vice President - Chief Financial Officer and Treasurer | |
| | | (as Principal Financial and Accounting Officer) | |
| | | | |
Date: | September 16, 2013 | | | |
Pursuant to the requirements of the Securities Exchange Act of 1934, this report has been signed below by the following persons on behalf of the registrant and in the capacities and on the date indicated.
|
| | | | |
/s/ J. Thomas Wilson | | Date: | September 16, 2013 | |
John Thomas Wilson, President and Chief Executive Officer, and Director | | | | |
| | | | |
/s/ Antoine J. Lafargue | | Date: | September 16, 2013 | |
Antoine J. Lafargue, Vice President - Chief Financial Officer, and Treasurer | | | | |
| | | | |
/s/ Vadim Gluzman | | Date: | September 16, 2013 | |
Vadim Gluzman, Director | | | | |
| | | | |
/s/ Robert I. Israel | | Date: | September 16, 2013 | |
Robert I. Israel, Director | | | | |
| | | | |
/s/ Brendan S. MacMillan | | Date: | September 16, 2013 | |
Brendan S. MacMillan, Director | | | | |
| | | | |
/s/ Walter McCann | | Date: | September 16, 2013 | |
Walter McCann, Director | | | | |
| | | | |
/s/ Ronald P. Pettirossi | | Date: | September 16, 2013 | |
Ronald P. Pettirossi, Director | | | | |
| | | | |
/s/ Milam Randolph Pharo | | Date: | September 16, 2013 | |
Milam Randolph Pharo Director | | | | |
| | | | |
/s/ J. Robinson West | | Date: | September 16, 2013 | |
J. Robinson West, Director | | | | |
INDEX TO EXHIBITS
|
| |
EXHIBIT | |
NUMBER | DESCRIPTION |
10.75* | Form of Restricted Stock Award Agreement under the 2012 Omnibus Incentive Compensation Plan |
10.76* | Form of Nonqualified Stock Option Award Agreement under the 2012 Omnibus Incentive Compensation Plan |
21.1* | Subsidiaries of the Registrant |
23.1* | Consent of EKS&H LLLP |
23.2* | Consent of Allen & Crouch Petroleum Engineers Inc. |
23.3* | Consent of Ryder Scott Company, L.P. |
31.1* | Certification of Chief Executive Officer pursuant to Section 302 of the Sarbanes-Oxley Act of 2002 |
31.2* | Certification of Chief Financial Officer pursuant to Section 302 of the Sarbanes-Oxley Act of 2002 |
32.1** | Certification of Chief Executive Officer pursuant to 18 U.S.C. Section 1350, as adopted pursuant to Section 906 of the Sarbanes-Oxley Act of 2002 |
32.2** | Certification of Chief Financial Officer pursuant to 18 U.S.C. Section 1350, as adopted pursuant to Section 906 of the Sarbanes-Oxley Act of 2002 |
99.1* | Summary reserves report of Allen & Crouch Petroleum Engineers, Inc. |
99.2* | Summary reserves report of Ryder Scott Company, L.P. |
101.INS*** | XBRL Instance Document |
101.SCH*** | XBRL Taxonomy Extension Schema Document |
101.CAL*** | XBRL Taxonomy Extension Calculation Linkbase Document |
101.DEF*** | XBRL Taxonomy Extension Definition Linkbase Document |
101.LAB*** | XBRL Taxonomy Extension Label Linkbase Document |
101.PRE*** | XBRL Taxonomy Extension Presentation Linkbase Document |
| |
* | Filed herewith. |
** | Furnished herewith. |
*** | Furnished herewith. Users of this data submitted electronically herewith are advised pursuant to Rule 406T of Regulation S-T that this interactive data file is deemed not filed or part of a registration statement or prospectus for purposes of sections 11 or 12 of the Securities Act of 1933, is deemed not filed for purposes of section 18 of the Securities Exchange Act of 1934, and otherwise is not subject to liability under these sections. |